


PepsiCo Hasn't Been This Cheap Relative to Free Cash Flow in 10 Years. Here's Why That's the Signal to Buy.
Key Points
PepsiCo shares have performed poorly since 2023 on lackluster revenue.
Recent adjustments and improvements, however, have quietly rekindled earnings growth.
The stock doesn’t reflect these improving fiscal metrics just yet, but it could soon enough.
- 10 stocks we like better than PepsiCo ›
There are several ways of measuring a stock's value, each of which has its own pros and cons. Perhaps the best-known way is a ticker's price-to-earnings (or P/E) ratio, which simply compares that stock's price to its underlying per-share profit. A company's top goal is generating earnings, after all.
A reported per-share bottom line, however, isn't necessarily the only meaningful means of weighing what a stock's worth. Although it's not a commonly considered valuation metric, in certain cases, cash flow can mean even more than a reported earnings figure.
Missed Nvidia in 2009? This Rare Signal Is Flashing Again. In 2009, a "Double Down" signal flashed for a little-known chipmaker called Nvidia. For the first time in years, that same "Total Conviction" signal is flashing for a company 1/100th the size of Nvidia. Continue »
To this end, on a free-cash-flow basis, shares of beverage company PepsiCo (NASDAQ: PEP) haven't been this cheap in a decade. You might want to dive in before other investors begin figuring it out.
But first things first.
What's cash flow?
There's certainly some similarity between profits and cash flow. But there are important differences as well.
Net profits are, of course, the difference between any given quarter's reported revenue and that same quarter's ongoing operating costs and ordinary expenses. Sometimes you'll also hear a non-GAAP (generally accepted accounting principles) profit figure that excludes unusual one-time expenses, which paints a more accurate picture of how that company is performing.

Image source: Getty Images.
Cash flow, on the other hand, is a measure of the dollars left over from actual collected revenue during a particular quarter after all of that quarter's bills are paid with real money. Notably, cash flow reflects any loans taken out or repaid during that accounting period, interest payments, depreciation, the amortized purchase of equipment, gains or losses on the sale of any assets, or any other actual cash-consuming cost. Free cash flow is the amount of real cash left behind after covering these costs, but without capital expenditures factored in, which -- like non-GAAP profits -- can sometimes paint a clearer picture of that particular company's current fiscal health.
Both are important metrics in their own right, too, even if they seemingly paint the same picture in a slightly different way. The chief difference between the two is just timing. The cost of manufacturing goods, providing services, or buying inventory isn't recognized on a profit-and-loss statement until that good or service is turned into billable revenue. The total net cost of procuring those goods or creating those services and everything even indirectly related to them, however, is reflected on a cash flow statement as they're paid for or sold.
Perhaps more to the point, reported profits illustrate a business's long-term viability, while cash flow tells you if a company generates enough short-term cash to cover costs that have already been incurred at the same time that business is incurring new ones. If enough actual dollars aren't flowing through the business fast enough, short-term financial strain chips away at long-term viability.
And it's this latter measure where PepsiCo is really shining now, even if most investors don't yet realize it.
PepsiCo's stealthy turnaround
The beverage and snack business is a low-margin one, and PepsiCo is no exception. Of last year's total revenue of $93.9 billion, only $8.2 billion (or 8.7%) was converted into net income. Not bad, but not great, either.
Except that net profit margins aren't the only important measure to consider here. Even if net profit margins are relatively thin, if a company can push its products through its sales channels faster and subsequently push more revenue through its accounting and cost pipeline at a faster clip, it can clear plenty of total money with a relatively small operation and physical footprint.
In other words, an efficient and effective operation can create strong cash flow even when profits and profit margins are modest.
PepsiCo is proof of this. After a much-needed overhaul, last year's operating cash flow was a solid $12.1 billion, allowing the company to invest a little more in its own growth as well as pay down a little more of its debt (which will eventually make a positive impact on operating profits). Moreover, the company's free cash flow through the first two reported quarters of this year isn't just growing, but soaring, reaching levels well above year-ago levels.
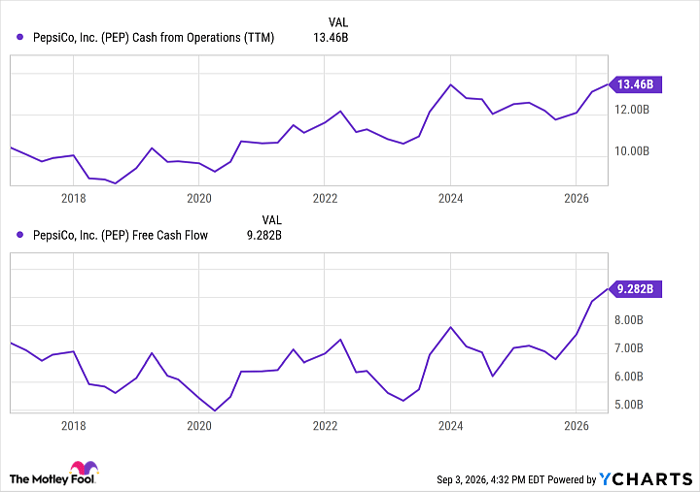
PEP Cash from Operations (TTM) data by YCharts
Yet, none of this is being reflected in the stock's price. PepsiCo shares have continued to slide since their 2023 peak, deflating the price-to-free-cash flow ratio to a 10-year low of just above 20.
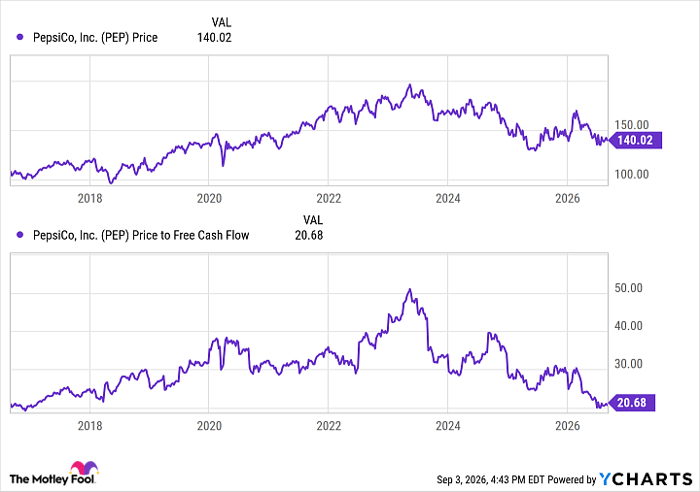
PEP data by YCharts
Paired with a bit of profit growth, the bullish argument is strong
It's a somewhat understandable hesitation. The company struggled following the wind-down of the COVID-19 pandemic, facing a combination of rising production costs and a product portfolio with waning relevancy. It took a toll on reported profitability, which, as was noted, is still an important fundamental metric.
Even by that measure, however, there's a light at the end of the tunnel. Last quarter's organic revenue growth rate improved to 2.4%, while smart acquisitions pumped up the company's Q2 top line by 6.4% year over year, leading to per-share profit growth of 4%. Analysts are looking for similar progress for the remainder of this year, as well as through next year.
Indeed, while not quite as compelling as its price-to-free-cash-flow ratio, PEP stock is still arguably undervalued at less than 16 times next year's projected per-share profit of $8.97. Perhaps the big bullish takeaway here is that -- unlike more than a few companies in similar scenarios -- PepsiCo can grow its reported profits and its actual free cash flow at the same time, rather than sacrificing one to grow the other. It's not unusual to see the two measures moving in the opposite direction, or at least one stagnating while the other rises.
So, connect the dots. The market isn't giving PepsiCo stock enough credit for how well the underlying company is starting to perform. Its rekindled free-cash-flow growth is just the centerpiece of its renewed bullish thesis.
Should you buy stock in PepsiCo right now?
Before you buy stock in PepsiCo, consider this:
The Motley Fool Stock Advisor analyst team just identified what they believe are the 10 best stocks for investors to buy now… and PepsiCo wasn’t one of them. The 10 stocks that made the cut could produce monster returns in the coming years.
Consider when Netflix made this list on December 17, 2004... if you invested $1,000 at the time of our recommendation, you’d have $421,997!* Or when Nvidia made this list on April 15, 2005... if you invested $1,000 at the time of our recommendation, you’d have $1,413,876!*
Now, it’s worth noting Stock Advisor’s total average return is 978% — a market-crushing outperformance compared to 213% for the S&P 500. Don't miss the latest top 10 list, available with Stock Advisor, and join an investing community built by individual investors for individual investors.
See the 10 stocks »
*Stock Advisor returns as of September 6, 2026.
James Brumley has no position in any of the stocks mentioned. The Motley Fool has no position in any of the stocks mentioned. The Motley Fool has a disclosure policy.
Recommended Articles


