


SanDisk Stock Price Forecast: Q2 NAND Flash Revenue Growth Lags Top Five Memory Makers, Stock Drops Below $1,700, Can the Rally Continue?
TradingKey - On August 18 Eastern Time, SanDisk (SNDK) stock price fell back below $1,700, snapping a six-day winning streak.
According to the latest NAND Flash industry research report from TrendForce, AI server procurement momentum remained robust in the second quarter of 2026. In particular, strong demand for enterprise SSDs resulted in market-wide NAND Flash supply shortages, allowing original manufacturers to significantly raise average selling prices (ASP) through price negotiation mechanisms. Among listed NAND Flash brands, the top five manufacturers recorded a combined quarterly revenue increase of 77% to $68.87 billion.
However, among the top five NAND Flash brands in the second quarter, SanDisk ranked last in quarterly growth at just 50.7%.
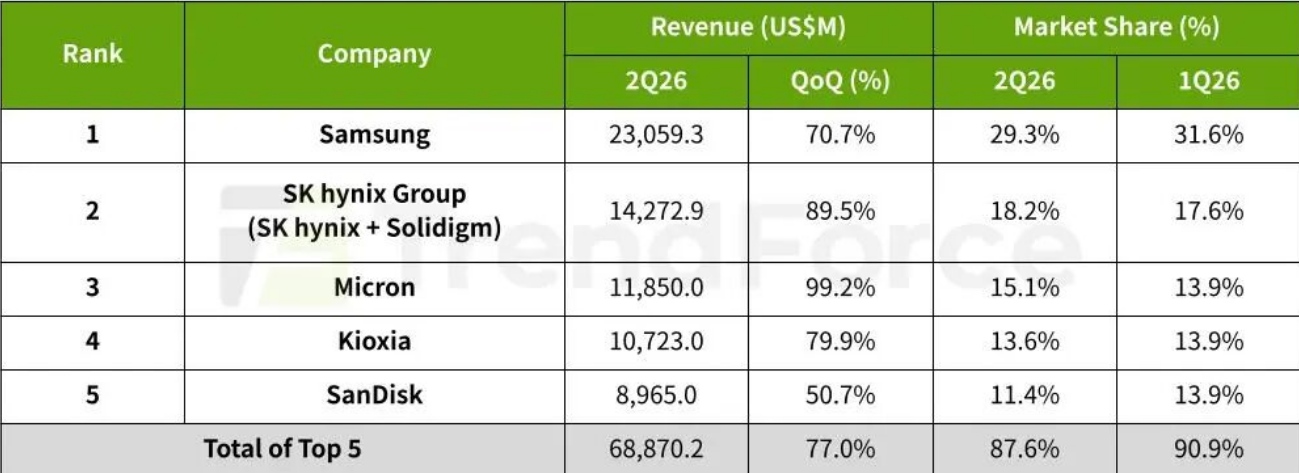
Revenue Ranking of Top 5 NAND Flash Brands in Q2 2026, Source: TrendForce
Among the other four NAND Flash brands, Samsung's Q2 NAND Flash revenue grew to nearly $23.06 billion, up 70.7% quarter-over-quarter. This was mainly driven by AI server demand boosting NAND Flash ASPs, along with a continuous increase in the proportion of enterprise SSD shipments, which significantly improved profitability.
SK Hynix's NAND Flash revenue rose 89.5% quarter-over-quarter, surpassing $14.27 billion, with operating margin hitting a record high. This was primarily attributed to the ongoing volume production of its 321L process and strong orders for Solidigm's high-capacity QLC enterprise SSDs.
Micron's NAND Flash revenue reached $11.85 billion, up 99.2% quarter-over-quarter, representing the highest growth rate among the top five brands and elevating its ranking to third place. Kioxia's NAND Flash revenue increased 79.9% quarter-over-quarter to around $10.72 billion, with its market share slipping slightly to 13.6%.
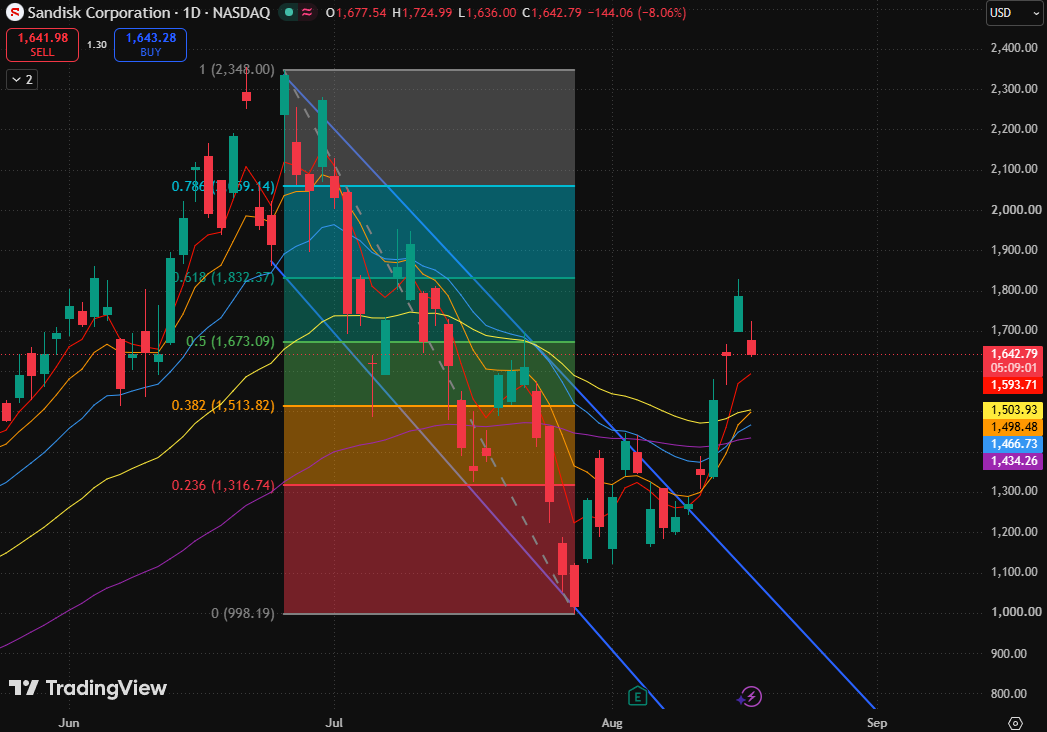
SanDisk Daily Chart, Source: TradingView
SanDisk's stock price previously broke above a downward trendline and rapidly reclaimed multiple moving averages from above the 0.236 Fibonacci retracement level ($1,316.74), with rebound momentum extending toward the $1,800 level at one point.
However, the stock price has fallen sharply recently and failed to hold above the 0.5 Fibonacci retracement level ($1,673.09), indicating that selling pressure from trapped overhead positions and profit-taking has begun to emerge. If the stock can regain $1,673.09 and stay above the short-term moving average zone, the rebound may challenge the 0.618 Fibonacci retracement level ($1,832.37) again; otherwise, the market will transition from an accelerated bounce into a more comprehensive consolidation.
Primary support is focused on the 0.382 Fibonacci retracement level ($1,513.82), which forms a short-term support zone alongside the 5-day, 10-day, and 20-day moving averages, serving as a key level to test the quality of this rebound. If held, the stock price still has a chance to consolidate within the $1,514 to $1,673 range.
If decisively broken, the next support level points to the 0.236 Fibonacci retracement level ($1,316.74), with caution required for potential movement toward the 40-day and 80-day moving averages.
Although the market remains bullish on NAND demand driven by AI inference and the company's long-term order framework, recent financial growth has been largely driven by rising memory prices. If changes occur in NAND pricing, AI capex expectations, or industry supply-demand dynamics, stock price pullbacks could be amplified. In the short term, particular attention should be paid to the risk of trend weakening if the $1,513.82 support is lost.
Recommended Articles


