


September Is Historically the Worst Month for the Stock Market. Is Now the Time to Cash Out?
Key Points
Last September, the S&P 500 rose by 3.5%, but when the market was crashing in 2022, it declined more than 9% during the month.
Given how hot the stock market has been in recent years, a pullback may be overdue.
Trying to time the market, however, can be a costly and risky strategy.
- 10 stocks we like better than S&P 500 Index ›
September is right around the corner, and it's not typically a great month for the stock market. In fact, historically, it's known to be the worst month for the markets. With the S&P 500 (SNPINDEX: ^GSPC) also being at record highs, there may be some added risk this time around.
Should investors consider taking their money out of the stock market before September hits, or is remaining invested still a good option for the long run?
Missed Nvidia in 2009? This Rare Signal Is Flashing Again. In 2009, a "Double Down" signal flashed for a little-known chipmaker called Nvidia. For the first time in years, that same "Total Conviction" signal is flashing for a company 1/100th the size of Nvidia. Continue »

Image source: Getty Images.
Is September destined to be a bad month for the stock market?
Historical data going back over a century suggest that stocks are less likely to rise in value in September than in other months of the year -- 43% versus 60% of the time, based on stocks in the Dow Jones Industrial Average.
Last year, the S&P 500 ended up rising by 3.5%. The year before that, it was up by 2%. However, in 2023, it did end up falling by nearly 5%, which still wasn't nearly as bad as the 9% decline it experienced in 2022, when the market was in the midst of a full-blown crash.
While historical data may suggest September is not usually a great month, it has been a good month for the stock market over the past couple of years. With investor sentiment strong and companies performing well, it's entirely plausible that stocks could rally next month.
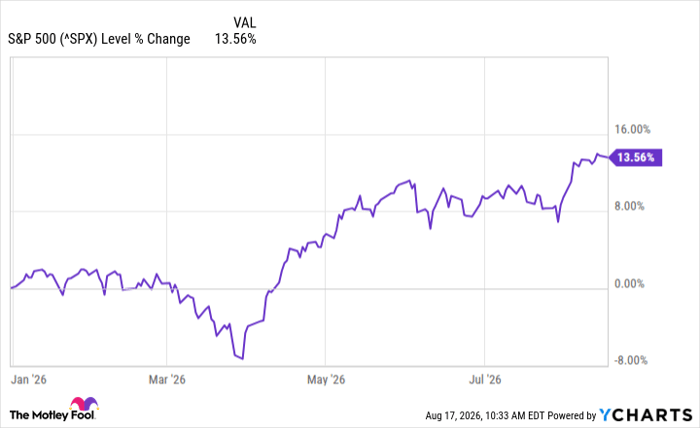
^SPX data by YCharts
Trying to time the market is risky
Getting in and out of the market based on historical trends isn't an ideal strategy, as it can lead to selling investments at inopportune times in favor of probabilities. That can result in missing out on potential gains later on, especially if the market remains hot.
Stocks may end up falling in September, for no other reason than valuations for many companies have become incredibly high this year, and a pullback is warranted. But there's no assurance that will happen, and investors don't need to exit the stock market or sell all their investments just because it's September. Every year is different, and there's no guarantee that getting out in September and buying back in later will be a good move.
For investors who are worried about risk, investing in value stocks or dividend stocks can be a more practical option than trying to time the market. And for those who aren't in a rush, simply staying invested and hanging on for the long run may still be the best approach.
Should you buy stock in S&P 500 Index right now?
Before you buy stock in S&P 500 Index, consider this:
The Motley Fool Stock Advisor analyst team just identified what they believe are the 10 best stocks for investors to buy now… and S&P 500 Index wasn’t one of them. The 10 stocks that made the cut could produce monster returns in the coming years.
Consider when Netflix made this list on December 17, 2004... if you invested $1,000 at the time of our recommendation, you’d have $421,511!* Or when Nvidia made this list on April 15, 2005... if you invested $1,000 at the time of our recommendation, you’d have $1,381,960!*
Now, it’s worth noting Stock Advisor’s total average return is 981% — a market-crushing outperformance compared to 216% for the S&P 500. Don't miss the latest top 10 list, available with Stock Advisor, and join an investing community built by individual investors for individual investors.
See the 10 stocks »
*Stock Advisor returns as of August 17, 2026.
David Jagielski, CPA has no position in any of the stocks mentioned. The Motley Fool has no position in any of the stocks mentioned. The Motley Fool has a disclosure policy.
Recommended Articles


