


Micron Stock Price Forecast: Shares Surge Past $1,000 Mark as Highest Market Target Reaches $2,200
TradingKey - Micron strongly breaches the $1,000 level, with extreme market bullishness targeting $2,200.
On August 17 Eastern Time, Micron Technology (MU) stock price continued to rebound strongly, breaking through the $1,000 mark again after three weeks. In pre-market trading today, Micron's stock price rose nearly 7% to around $1,007, hitting its highest level since July 23. So, will Micron's stock price continue to rise and set new highs?
Why Is Micron Stock Rising?
After bottoming out in early August, Micron's stock price surged all the way from around $800 in early August to break through the $1,000 mark, accumulating a gain of over 25% within half a month. Micron's strong rebound is no coincidence, but driven jointly by multiple core catalysts.
As Micron prioritizes tilting a large portion of its wafer capacity toward high-margin HBM, with capacity already fully booked through 2027, conventional Server DRAM such as DDR5 and LPDDR5X has experienced a major structural shortage. As a supplier, Micron's capacity consumption has instead driven across-the-board price hikes for its products, and the company is currently enjoying this dividend.
In addition, the stock price rise was also affected by the sector resonance effect from peer SanDisk (SNDK). On August 13, SanDisk announced a dream gross margin guidance of up to 80% and a long-term contract backlog of nearly $94 billion at its Investor Day, completely dispelling market concerns over memory cycle oversupply. As one of the dual leaders in DRAM/HBM, Micron immediately received a strong re-rating premium, driving its stock price up by nearly 5% in a single day.
How Wall Street Views Micron Stock
Among the more than 40 analysts covering Micron, over 80% give a "Buy" or "Overweight" rating, with the highest price target at $2,200. A few institutions hold a bearish stance, believing Micron's stock price could drop below $400 at lowest, while Wall Street institutions mainly maintain targets in the $1,100–$1,700 range, as follows:
Institution | 12-Month Price Target (USD) | Core Logic & Views |
UBS | 1,625 | Long-term supply agreements (SCA) cap downside risk, providing extremely high visibility for FY2029 EPS. |
Deutsche Bank | 1,550 | AI servers drive robust demand for Server DRAM, while wafer capacity shortages remain unresolved. |
Mizuho | 1,375 | Cloud giants expand AI capex, securing Micron's solid leadership advantage in high-bandwidth memory. |
Morgan Stanley | 1,200 | Takes a relatively cautious stance, but acknowledges the long-term valuation rerating driven by HBM market share gains. |
Citi | 1,150 | While cautioning against long-term capacity ramp-up risks, near-to-mid-term fundamentals are exceptionally strong. |
Micron Stock Technical Analysis: Holding $1,000 Is Key
After pulling back from its $1,255 ceiling reached in June this year, Micron completed a textbook share turnover and secondary bottoming between late July and early August. After short-term weak hands were cleared out, accompanied by a breakout on high volume, it directly formed a strong technical V-shaped reversal and released bullish signals.
Currently, on the daily chart, Micron's stock price continues to diverge upward after completing a golden cross below the zero line, confirming bullish dominance. Furthermore, the RSI has risen from near the oversold zone in late July to a bullish strong zone of 56, and has not yet entered the overheated overbought stage of >70, indicating that technical upside space remains. The next step will be to directly challenge the all-time high ceiling of $1,255 set in June this year. However, if it fails to stabilize above $1,000 this week, it would mean the rebound is over, and the price could pull back toward around $700 again.
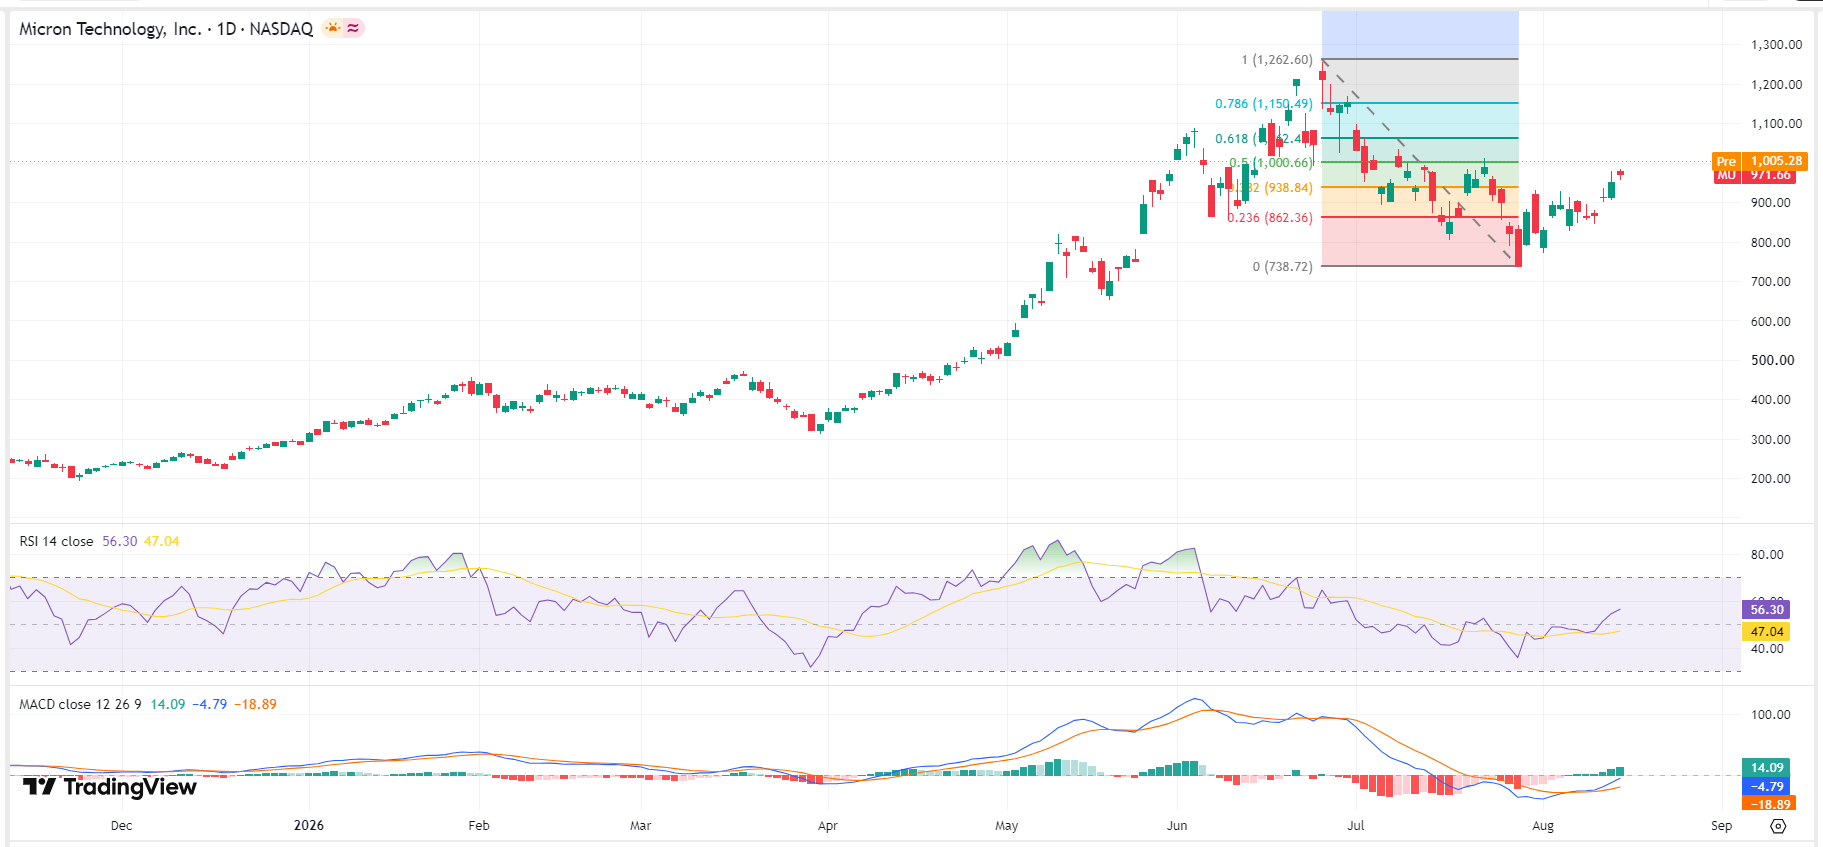 Micron stock price chart, source: TradingView
Recommended Articles


