


The Vanguard S&P 500 ETF (VOO) Beat the Vanguard Morningstar Total Stock Market ETF (VTI) for 4 Straight Years. Here's Why That's About to Change.
Key Points
Mega-cap growth stocks have been driving the U.S. stock market and market-cap weighted indexes like the S&P 500 to new heights.
The Total Stock Market ETF’s exposure to small and mid-cap stocks is making a difference in 2026.
The Total Stock Market ETF will buy IPO stocks much more quickly than the Vanguard S&P 500 ETF.
- 10 stocks we like better than Vanguard S&P 500 ETF ›
The Vanguard S&P 500 ETF (NYSEMKT: VOO) and Vanguard Morningstar Total Stock Market ETF (NYSEMKT: VTI) are two of the simplest and most cost-effective ways to get exposure to the broader U.S. stock market.
The Vanguard S&P 500 ETF mirrors the performance of the S&P 500 (SNPINDEX: ^GSPC), while the Vanguard Total Stock Market ETF reflects the entire U.S. stock market with 3,531 holdings. Given that the S&P 500 makes up roughly 80% of the total U.S. stock market, investors may view the two ETFs as virtually interchangeable. But it's impossible to ignore that the Vanguard S&P 500 ETF outperformed the Total Stock Market ETF from 2022 through 2025, and why that pattern is breaking.
Missed Nvidia in 2009? This Rare Signal Is Flashing Again. In 2009, a "Double Down" signal flashed for a little-known chipmaker called Nvidia. For the first time in years, that same "Total Conviction" signal is flashing for a company 1/100th the size of Nvidia. Continue »

Image source: Getty Images.
When it comes to ETFs, cost is king
The Vanguard S&P 500 ETF became the first ETF to surpass $1 trillion in net assets earlier this year. The Vanguard Total Stock Market ETF is massive too, with $666.9 billion in net assets as of July 31.
Both ETFs have reduced their annual fees as they have grown in size. They now charge mere 0.03% expense ratios -- or just $3 for every $10,000 invested. For context, other popular ETFs like the SPDR S&P 500 ETF Trust (NYSEMKT: SPY) have a 0.0945% expense ratio, the Invesco QQQ ETF (NASDAQ: QQQ) charges 0.18%, and active ETFs managed by Cathie Wood, such as the ARK Innovation ETF, feature 0.75% expense ratios.
The slight differences may not seem like much, but they can compound over time. Especially for folks who are looking for a broad-market ETF to contribute to and hold over a multi-decade period. This is why understanding the differences between investing in a passive S&P 500 fund and a total U.S. stock market fund is paramount.
Mega cap dominance
The Vanguard S&P 500 ETF is essentially a slightly more concerted version of the Total Stock Market ETF. With fewer holdings, it assigns a higher weight to the S&P 500 components than the Total Stock Market ETF does. The difference is tiny for most holdings. But in mega-cap territory, the concentration is more notable.
For example, the S&P 500 ETF has a 7.5% weighting in Nvidia compared to 6.3% for the Total Stock Market ETF. Nvidia, Apple, Alphabet, Microsoft, Amazon, Broadcom, Meta Platforms, Tesla, Micron Technology, and Eli Lilly account for 37.9% of the S&P 500 ETF, compared with 33.3% for the Total Stock Market ETF.
Mega-cap and large-cap stocks drive the performance of both ETFs. But the Vanguard S&P 500 ETF's extra weightings in high-octane growth stocks like Nvidia have paid off in recent years because those stocks have outperformed the mid-cap and small-cap stocks that make up roughly 20% of the Total Stock Market ETF.
A rebound in small- and mid-cap stocks
This year is different.
|
Total Return |
2021 |
2022 |
2023 |
2024 |
2025 |
2026 YTD |
|---|---|---|---|---|---|---|
|
Vanguard S&P 500 ETF |
25.7% |
(18.2%) |
26.3% |
25% |
17.8% |
13.9% |
|
Vanguard Morningstar Total Stock Market ETF |
28.8% |
(19.5%) |
26.1% |
23.8% |
17.1% |
14.6% |
Data source: Vanguard. Note: The 2026 figure is as of the Aug. 13 market close.
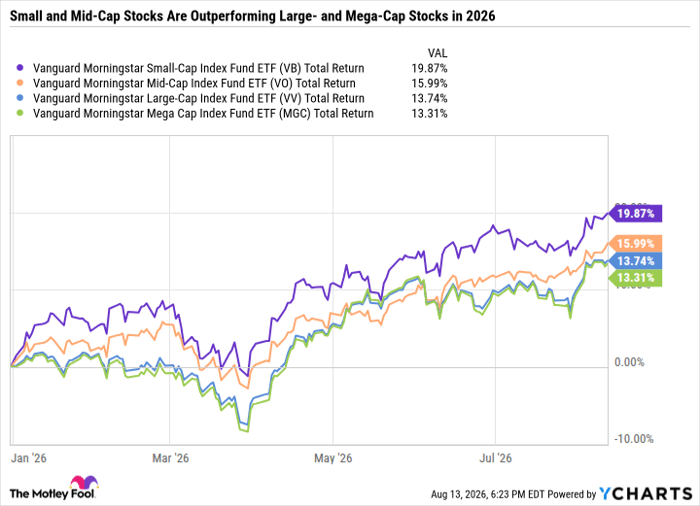
The Total Stock Market ETF is outperforming the S&P 500 ETF because it has exposure to small- and mid-cap stocks.
Data by YCharts.
Even after their recent run-up, mid and small caps are still generally cheaper than large caps -- as the Vanguard Morningstar Small-Cap ETF (NYSEMKT: VB) features a 22.3 price-to-earnings (P/E) ratio compared to 24.1 for the Vanguard Morningstar Mid-Cap ETF (NYSEMKT: VO) and 27.5 for the Vanguard S&P 500 ETF.
Some investors may be willing to pay a premium for large-cap companies if they believe they offer higher-quality growth prospects than smaller companies. Although the S&P 500's valuation is elevated compared to historical levels, many of today's market leaders have high profit margins, excellent balance sheets, and impeccable pricing power. So investors who believe these companies can continue to drive broader market gains may still prefer the S&P 500 ETF over the Total Stock Market ETF. Whereas folks looking for a bit more of a value tilt may lean toward the Total Stock Market ETF.
Another distinction worth noting is that the Total Stock Market ETF is far more flexible than the S&P 500 ETF. The Vanguard S&P 500 ETF is benchmarked to the S&P 500 index, so its components will change only when the index's composition shifts. For example, Space Exploration Technologies held its initial public offering (IPO) on June 12 and won't be added to the S&P 500 until June 2027 at the earliest. But as of June 30, the Total Stock Market ETF already bought 18.74 million shares of SpaceX stock, and likely added significantly to that position in July.
By mid-December, all of SpaceX's shares will be unlocked, and it could become a top 10 holding in the Total Stock Market ETF once it is weighted by market cap. Whereas the Vanguard S&P 500 will have no exposure. A similar pattern is likely to follow for other blockbuster mega-cap IPOs, such as Anthropic and OpenAI.
The better low-cost ETF to buy now
The Vanguard S&P 500 ETF and Total Stock Market ETF both have what it takes to be the primary investment vehicles for getting low-cost, broad-based market exposure. However, I think the Total Stock Market ETF is the better buy because it better captures the entire market as it is more flexible than the Vanguard S&P 500 ETF.
The Total Stock Market ETF could also be a better buy if you already own some top S&P 500 stocks and want to limit the duplication of your existing holdings.
Should you buy stock in Vanguard S&P 500 ETF right now?
Before you buy stock in Vanguard S&P 500 ETF, consider this:
The Motley Fool Stock Advisor analyst team just identified what they believe are the 10 best stocks for investors to buy now… and Vanguard S&P 500 ETF wasn’t one of them. The 10 stocks that made the cut could produce monster returns in the coming years.
Consider when Netflix made this list on December 17, 2004... if you invested $1,000 at the time of our recommendation, you’d have $421,511!* Or when Nvidia made this list on April 15, 2005... if you invested $1,000 at the time of our recommendation, you’d have $1,381,960!*
Now, it’s worth noting Stock Advisor’s total average return is 981% — a market-crushing outperformance compared to 216% for the S&P 500. Don't miss the latest top 10 list, available with Stock Advisor, and join an investing community built by individual investors for individual investors.
See the 10 stocks »
*Stock Advisor returns as of August 16, 2026.
Daniel Foelber has positions in Broadcom and Nvidia and has the following options: short August 2026 $240 calls on Nvidia. The Motley Fool has positions in and recommends Alphabet, Amazon, Apple, Broadcom, Eli Lilly, Meta Platforms, Micron Technology, Microsoft, Nvidia, Tesla, Vanguard Morningstar Mid-Cap ETF, and Vanguard S&P 500 ETF. The Motley Fool has a disclosure policy.
Recommended Articles


