


President Donald Trump Claims Costs Are "All Coming Down Now," but the Evolution of Trumpflation Appears to Be Having the Opposite Effect
Key Points
Although the Dow Jones Industrial Average, S&P 500, and Nasdaq Composite have rocketed to new highs under President Trump, above-average inflation stands out as a serious headwind.
Following a meaningful decline in headline inflation for June, Trump proclaimed that "costs are coming way down."
However, the price stickiness of Core Personal Consumption Expenditures (PCE) suggests that Trumpflation is becoming entrenched in the U.S. economy.
- 10 stocks we like better than S&P 500 Index ›
As has been the case throughout Donald Trump's presidency, the stock market is flourishing. Since early June, the iconic Dow Jones Industrial Average (DJINDICES: ^DJI), broad-based S&P 500 (SNPINDEX: ^GSPC), and growth-stock-fueled Nasdaq Composite (NASDAQINDEX: ^IXIC) have vaulted to record highs.
However, the state of the U.S. economy under Trump is a different story. Several of the president's policies are directly affecting the U.S. inflation rate, which can change the course of the economy and Wall Street.
Missed Nvidia in 2009? This Rare Signal Is Flashing Again. In 2009, a "Double Down" signal flashed for a little-known chipmaker called Nvidia. For the first time in years, that same "Total Conviction" signal is flashing for a company 1/100th the size of Nvidia. Continue »
While President Trump has been adamant that costs are coming down for consumers, the evolution of Trumpflation (inflation driven by the president's policies) paints a far different picture.
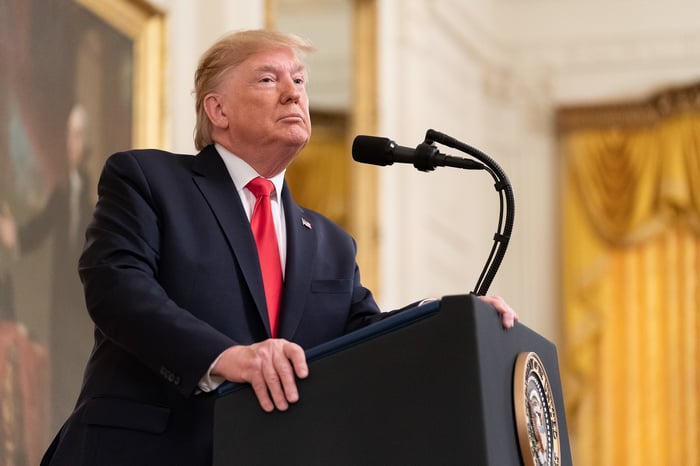
President Trump delivering remarks. Image source: Official White House Photo by Shealah Craighead, courtesy of the National Archives.
Headline inflation has eased from a three-year high
Some degree of inflation (rising prices) is normal and healthy for an expanding economy. When consumers are spending freely, businesses should possess modest pricing power over their goods and services. This is why the Federal Reserve targets a long-term inflation rate of 2% and not 0%.
But June marked the 64th consecutive month that U.S. trailing 12-month (TTM) inflation exceeded the Federal Open Market Committee's long-term 2% target. Since the start of Donald Trump's second term, two of his policies have boosted TTM inflation: tariffs and the Iran war.
The president unveiled his tariff and trade policy in early April 2025, consisting of a sweeping global tariff and dozens of higher reciprocal tariffs on countries deemed to have adverse trade imbalances with America. Even though the U.S. Supreme Court invalidated most of these tariffs in a February 2026 ruling, the Trump administration has since reimposed sweeping global tariffs, ranging from 10% to 12.5%, on more than 80 countries.
Adding duties to select imported goods can increase domestic manufacturing costs, which are then passed on to consumers. Both former Fed Chair Jerome Powell and current Fed Chair Kevin Warsh have cited Trump's tariffs as a source of elevated prices in the goods sector.
64.
-- Charlie Bilello (@charliebilello) July 14, 2026
As in 64 consecutive months with US inflation above the Fed's 2% target.
The Fed has lost all credibility when it comes to fighting inflation. pic.twitter.com/FHWlOX572E
The other Trumpflation catalyst is the Iran war. Shortly after the president green-lit military operations against Iran on Feb. 28, the latter closed the Strait of Hormuz to virtually all maritime traffic. This decision effectively halted the daily flow of a fifth of the world's petroleum liquids.
In the weeks that followed, gas prices skyrocketed at the fastest pace in more than three decades. Rapidly rising fuel prices almost single-handedly drove TTM inflation from a reported 2.4% in February to a three-year high of 4.2% in May.
But the June inflation report appeared to offer a silver lining. With peace talks between the U.S. and Iran ramping up in June, crude oil prices plummeted back to pre-war levels. Although fuel prices don't decline as quickly as they rise during energy supply shocks, this notable dip in crude oil prices sent June's TTM inflation to 3.5%.
In an Aug. 4 interview with Fox News journalist Trace Gallagher, President Trump took a victory lap on the latest inflation data. Said the president:
Costs are coming way down. I inherited, you know, they talk about costs. I inherited very, very high costs, and they're all coming down now. The food, the groceries, it's all coming down.
While the headline inflation figure would appear to concur with the president's claim that price increases have tamed a bit since May, core inflation data, coupled with evidence that Trumpflation is evolving, paint a worrisome picture for the U.S. economy and stock market.

Image source: Getty Images.
Trumpflation has entered its next phase -- and that's problematic for the economy and Wall Street
Whereas headline inflation has shown clear signs of easing since May, it's a different story altogether when discussing Core Personal Consumption Expenditures (PCE). Core PCE removes volatile food and energy costs from the equation, allowing economists to examine long-term price trends.
In June, Core PCE eased from a nearly three-year high of 3.4% to (drum roll)... 3.3%. According to forecasts from the Federal Reserve Bank of Cleveland's Inflation Nowcasting tool, Core PCE is expected to remain steady at 3.31% in July before slightly reaccelerating to 3.36% in August.
The price stickiness associated with Core PCE strongly suggests that Trumpflation has entered its next phase and is now entrenched in the broader economy.
BREAKING: US June PCE inflation, the Fed's preferred inflation metric, falls to 3.7%, in-line with expectations.
-- The Kobeissi Letter (@KobeissiLetter) July 30, 2026
Core PCE inflation fell to 3.3%, the second highest reading since October 2024.
US inflation continues to run at nearly double the Fed's 2% target.
Until recently, all focus has been on the closure of the Strait of Hormuz and what that might mean for fueling up our vehicles or heating our homes. But the Iran war is about much more than just energy prices. In addition to these front-and-center costs, we're beginning to see other impacts:
- Businesses have been forced to reroute shipments and/or change suppliers, leading to higher transportation costs that are then passed on to consumers.
- Petroleum-based products, including plastics and synthetic polymers, have increased in price.
- Roughly a third of the world's fertilizer passes through the Strait of Hormuz. Its closure can lead to higher fertilizer prices and/or a supply shortage that can adversely impact U.S. crop yields.
The point being that it's unlikely we've witnessed the worst of Trumpflation. Even though headline inflation is declining as energy prices ease, evidence is mounting that Trump-driven inflation is becoming ingrained in the U.S. economy.
Not only does persistently above-average inflation threaten to reduce discretionary spending, but it could do a number on the high-flying stock market.
If the Federal Reserve is forced into action and raises interest rates to combat above-average inflation, the stock market's No. 1 catalyst, the artificial intelligence (AI) data center build-out, may take it on the chin. This AI infrastructure build-out is being financed at least in part with debt. If this expansion slows in any meaningful way due to higher borrowing costs, it may well spell the end to the second-priciest stock market in history.
While President Trump has been quick to declare victory over inflation, the evolution of Trumpflation suggests this battle is just getting started.
Should you buy stock in S&P 500 Index right now?
Before you buy stock in S&P 500 Index, consider this:
The Motley Fool Stock Advisor analyst team just identified what they believe are the 10 best stocks for investors to buy now… and S&P 500 Index wasn’t one of them. The 10 stocks that made the cut could produce monster returns in the coming years.
Consider when Netflix made this list on December 17, 2004... if you invested $1,000 at the time of our recommendation, you’d have $421,511!* Or when Nvidia made this list on April 15, 2005... if you invested $1,000 at the time of our recommendation, you’d have $1,381,960!*
Now, it’s worth noting Stock Advisor’s total average return is 981% — a market-crushing outperformance compared to 216% for the S&P 500. Don't miss the latest top 10 list, available with Stock Advisor, and join an investing community built by individual investors for individual investors.
See the 10 stocks »
*Stock Advisor returns as of August 16, 2026.
Sean Williams has no position in any of the stocks mentioned. The Motley Fool has no position in any of the stocks mentioned. The Motley Fool has a disclosure policy.
Recommended Articles


