


Nvidia Stock Price Forecast: Nvidia Partners With Six Wall Street Giants to Raise $500 Billion, May Support Stock Rise to $300
TradingKey - As of August 13 Eastern Time, Nvidia (NVDA) was priced at $225.3. Recently, NVDA sharply rebounded from below $200 in early August to above $224 and continued its advance this week. Technical analysis shows that the overall stock price trend remains upward, with the stock expected to hit a new all-time high. Fundamentally, the most important factor affecting the stock price recently is Nvidia's collaboration with six Wall Street financial giants.
Why Nvidia Teaming Up With Wall Street to Raise $500 Billion Is Bullish for NVDA
According to reports, Nvidia announced an AI compute financing platform in partnership with Goldman Sachs, Apollo, BlackRock, Blackstone, Brookfield, and KKR, aiming to raise over $500 billion in third-party capital to support the construction of data centers, AI chips, and related infrastructure.
The most direct significance of this initiative is to help Nvidia resolve a practical challenge facing AI infrastructure growth: customers have demand for compute power, but do not necessarily have sufficient capital to purchase large quantities of GPUs and build data centers all at once.
In the past, AI infrastructure buildout mainly relied on cash-flow-rich tech giants such as Microsoft (MSFT), Meta (META), Amazon (AMZN), and Google (GOOGL), but as AI investment expands to CoreWeave (CRWV), AI labs, enterprises, and government projects, an increasing number of customers require external financing support.
If these customers can obtain lower-cost, longer-term capital through Wall Street, they can expand the scale of their GPU procurement and data center construction, thereby increasing potential orders for Nvidia's future Blackwell, Rubin, and full AI systems.
Both Morgan Stanley and Bank of America believe this collaboration will also help alleviate market concerns over Nvidia's "circular financing." In the past, the market worried that Nvidia was indirectly driving customers to continue purchasing its GPUs by investing in them or providing capital to AI companies, creating a closed loop between AI demand and financing. The new financing platform shifts more funding sources to third-party institutions such as BlackRock, Apollo, and Goldman Sachs, leaving professional investors to independently assume project risks.
Nvidia CEO Jensen Huang stated that AI computing is forming a new asset class. Through long-term leases, usage fees, and asset securitization, GPUs and AI data centers can generate continuous cash flow, enabling long-term capital such as insurance companies, pension funds, and sovereign wealth funds to participate in AI infrastructure investment.
If this model ultimately takes hold, the biggest impact on Nvidia will be a significant expansion of funding sources for AI capital expenditure. AI infrastructure will no longer rely primarily on the balance sheets of tech companies, but can instead draw hundreds of billions of dollars or even greater funding support from traditional financial markets.
Nvidia Stock Technical Analysis
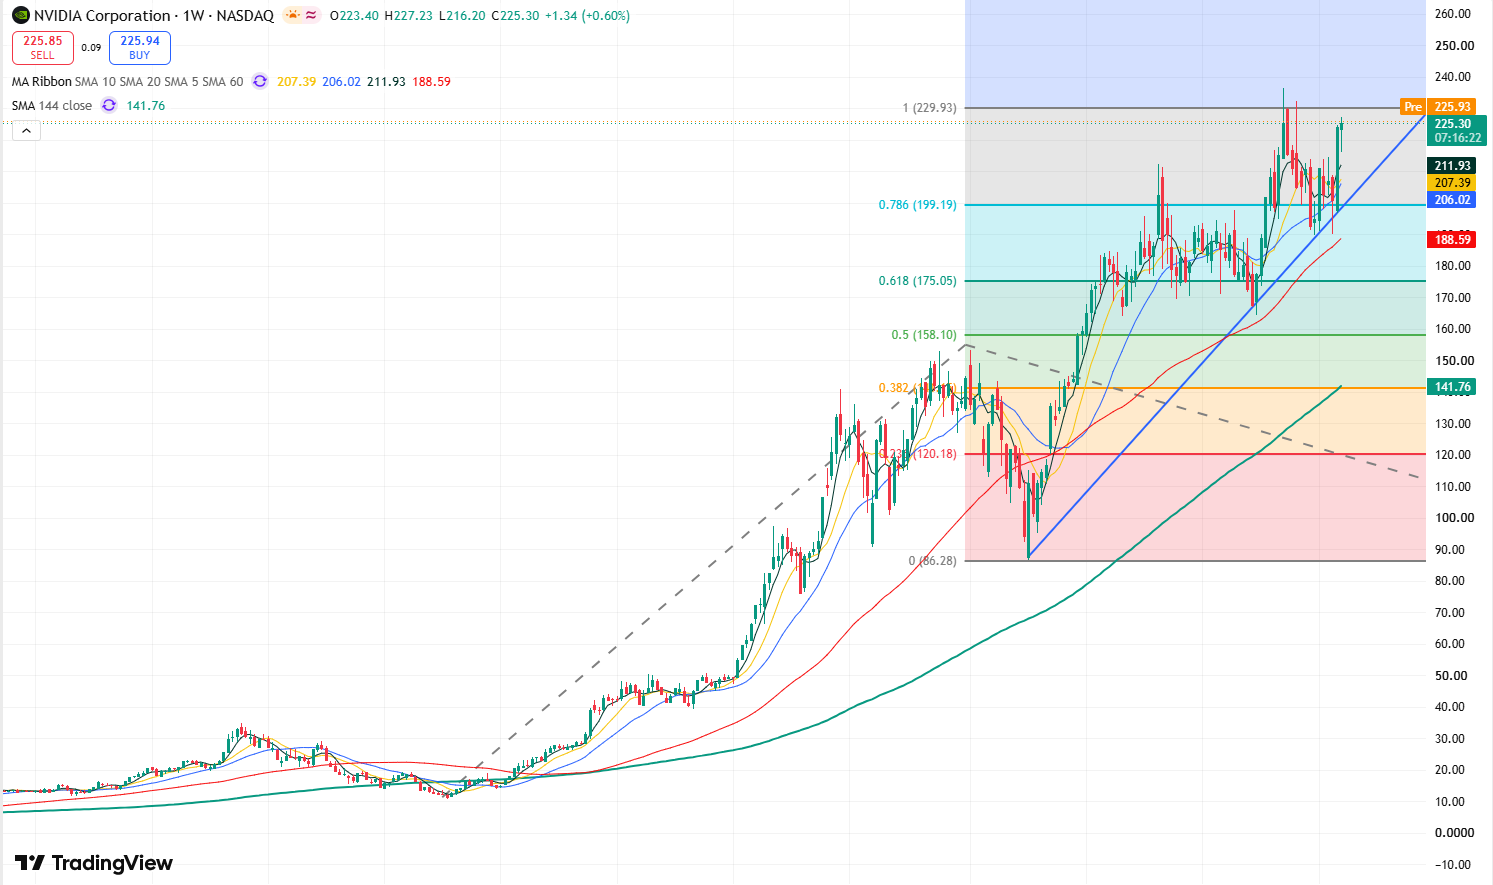
Nvidia weekly stock price chart, Source: TradingView
Looking at Nvidia's weekly price chart, the recent candlestick pattern shows a structure of consistently higher highs and higher lows. Connecting the recent candlestick lows forms a clear bullish trendline, indicating that the overall trend remains bullish. Furthermore, as the SMA60 and SMA144 maintain a bullish alignment in the moving average system, it further demonstrates the strong sustainability of the upward trend.
At present, the stock price retested the bullish trendline in early August, and last week's weekly chart formed a long bullish candle, indicating that bullish sentiment dominates the market. On the upside, the primary resistance level to watch is the $230-$236 region. If the stock breaks through its all-time high of $236.54, it will open up upside space toward the $300 mark.
On the downside, the primary support level to watch below is near $210. If this level is lost, the stock price may test the $200 mark. Further down, attention should be paid to the key support level at $190. If the stock price falls below $190, it may enter a deeper correction phase, potentially falling toward $165.
Recommended Articles


