

Micron Surges 4% Ahead of CPI: Can It Reclaim the $900 Mark?

Source Tradingkey

TradingKey - Micron Technology stock pushes higher toward the $900 mark; will the upcoming CPI data boost it to break through this threshold?

On August 12 Eastern Time, Micron Technology (MU) rose nearly 4% in pre-market trading, with its stock price closing in on $898.52, just shy of the $900 major mark. Whether Micron can ride the momentum to reclaim the $900 psychological level today highly depends on the upcoming U.S. July CPI data and intra-day technical selling pressure from breakeven traders.

Wall Street giants like UBS and Mizuho noted in their latest reports that Micron's high-bandwidth memory (HBM3e/HBM4) capacity for 2026 through 2027 has been fully sold out to AI giants such as Nvidia. Despite this, Micron's stock price has recently fluctuated lower, trading in a narrow range below $900. However, with the U.S. set to release CPI data, capital inflows taking positions have driven a rebound in Micron's stock price, demonstrating strong bullish market momentum.

Last Friday (August 7), the U.S. July Non-Farm Payrolls (NFP) report unexpectedly came in cold, well below expectations, fueling market expectations for a Federal Reserve rate cut in September. If the upcoming inflation data cools, it will further consolidate expectations for a Fed rate cut in September, boosting market risk appetite and giving Micron a strong chance to break above $900 on heavy volume. Conversely, if CPI exceeds expectations, sticky inflation could drive U.S. Treasury yields higher, triggering profit-taking in tech stocks at elevated levels and potentially eroding Micron's pre-market gains to reverse into a decline.

Since late June, Micron's stock price has continued to decline to new lows, with rebound highs simultaneously trending lower to form a downward channel—a classic bearish signal. More notably, after briefly touching psychological levels of $1,000 and $900 during rebounds, the stock failed to break through or stabilize, ultimately reversing into a decline.
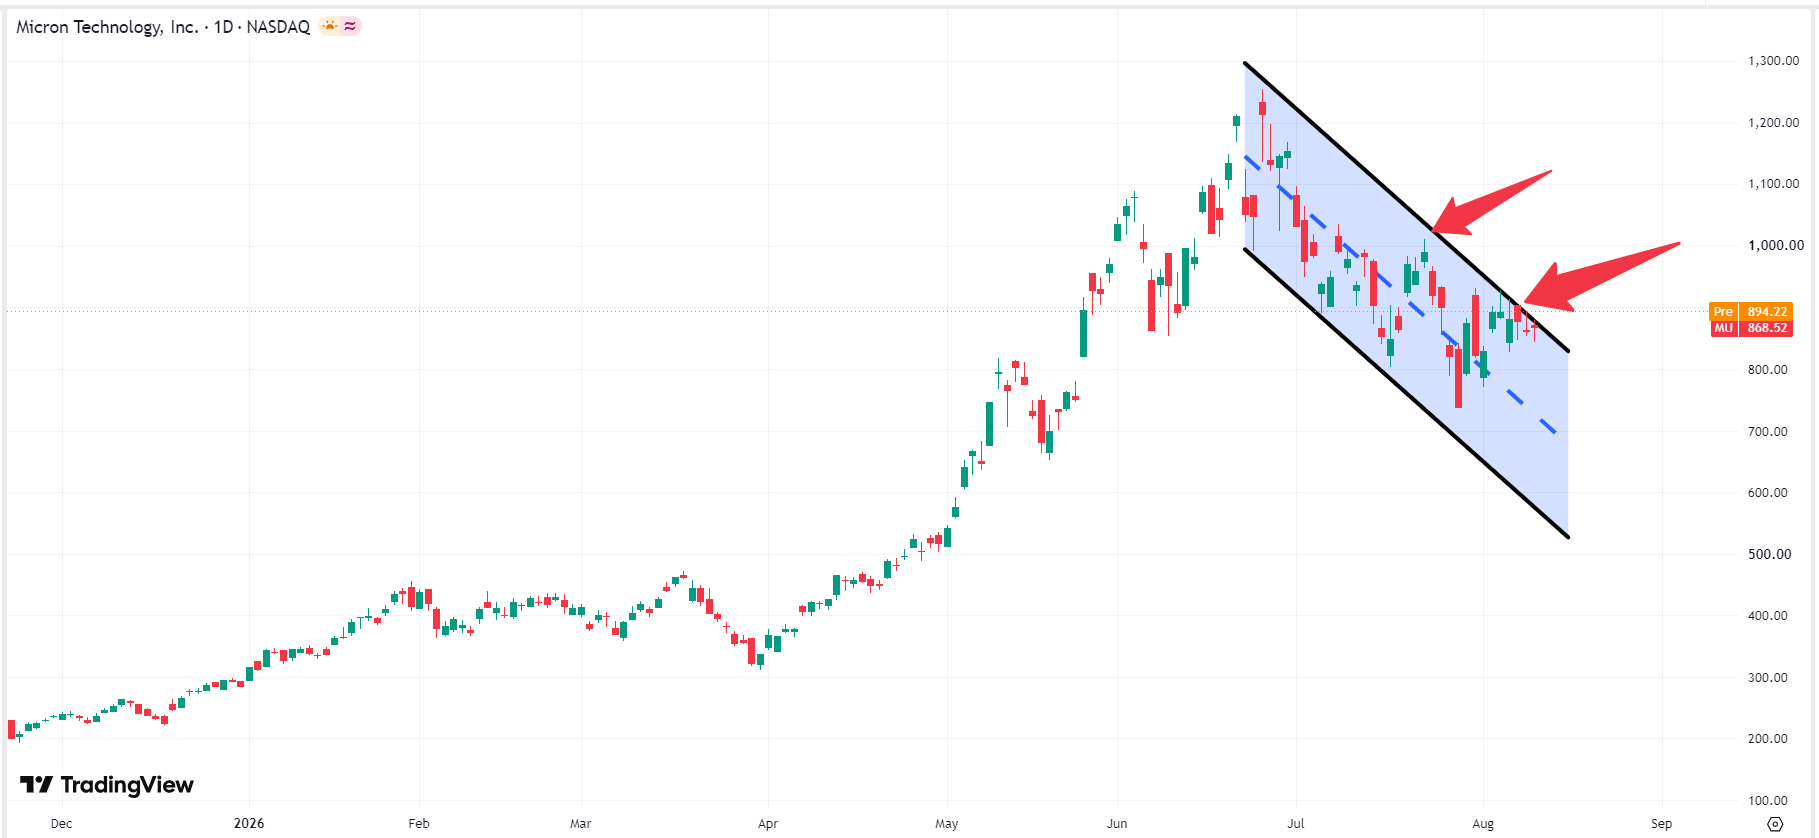
micron-mu-price-6e4fa2d9bbc54cb6b41b53114caefc4aMicron stock price chart, Source: TradingView

Disclaimer: For information purposes only. Past performance is not indicative of future results.
placeholder
Will the Tech Rally Continue? The Technical Verdict on the NASDAQ 100 Riding a massive 32% post-earnings wave, the Nasdaq-100 is showing its first signs of exhaustion. We break down crucial exit and entry rules for long positions this week.
Author  Mitrade Team
Jun 05, Fri
Riding a massive 32% post-earnings wave, the Nasdaq-100 is showing its first signs of exhaustion. We break down crucial exit and entry rules for long positions this week.
placeholder
XRP Price Prediction for July 2026: Can Buyers Finally Break the Downtrend?XRP (XRP) price trades near $1.05, caught between a year-long downtrend and a sudden burst of buying.July has historically rewarded XRP holders. This year the month arrives with on-chain accumulation
Author  Beincrypto
Jun 30, Tue
XRP (XRP) price trades near $1.05, caught between a year-long downtrend and a sudden burst of buying.July has historically rewarded XRP holders. This year the month arrives with on-chain accumulation
placeholder
Smart Money is Leaving Nvidia for This AI Chip StockNvidia stock price keeps sliding, yet the usual dip buyers are missing. Institutional money flow on the stock is the most negative of any major chip name, which means big investors are stepping back i
Author  Beincrypto
Jun 30, Tue
Nvidia stock price keeps sliding, yet the usual dip buyers are missing. Institutional money flow on the stock is the most negative of any major chip name, which means big investors are stepping back i
placeholder
What to Expect From Ethereum (ETH) in July 2026Ethereum (ETH) enters July 2026 trading near $1,570, close to multi-month lows, after recording its first run of three consecutive red quarterly candles in its history.On-chain data and price charts n
Author  Beincrypto
Jul 01, Wed
Ethereum (ETH) enters July 2026 trading near $1,570, close to multi-month lows, after recording its first run of three consecutive red quarterly candles in its history.On-chain data and price charts n
placeholder
XAUUSD Gold Analysis: Gold Holds Above $4,350 Ahead of US Inflation Data Is $4,500 Next? Gold holds above $4,350 following weak US jobs data. As inflation reports approach and UBS eyes $5,000, can XAUUSD break resistance at $4,435 to rally toward $4,500?
Author  Naoufal Seddik
12 hours ago
Gold holds above $4,350 following weak US jobs data. As inflation reports approach and UBS eyes $5,000, can XAUUSD break resistance at $4,435 to rally toward $4,500?
goTop
quote