


AMD Beat Revenue at $11.5B and Data Center +107% — But the Stock Just Broke $476 Support
TradingKey - AMD’s Q2 2026 results showed bright spots everywhere with a 50% YoY revenue increase to $11.536 billion and a Data Center revenue spike to $6.7 billion with a 107% increase. There’s also the strong number of gross margins, holding steady at 56% in the non-GAAP realm. Despite all that positive momentum, the stock is trading in the bear market now and broke down the important $476.13 support level to trade at $474.21 and showed a glut to the downside of $455.38.
The technical picture is clearly a bear picture and AMD has now broken below the lower boundary of its symmetrical triangle, all while trading below the 50-EMA at $488.55 and the 100-EMA at $497.53 along with an RSI of 44 sitting below the neutral 50 line.
From the trading side of things, the breakdown of $476.13 means sell. For the investors, the breakdown of $476.13 is a sell signal, but at what cost? Did valuation finally win against fundamental momentum? So, how should investors be positioning themselves and thinking in terms of the cost of valuation breakdowns? Is this pullback to buy the dip before the next run volume surge the correct position?
The Q2 Operational Story Remains Strong
AMD reported a 50% year over year growth in revenue and $11.536B against analyst estimates of $11.3B. With a double digit growth in Data Center revenue of $6.7B and demand for AI hyperscalers, the client segment realized a growth of 23% to $3.1B. Gaming revenue recorded a decline of 31% to $779M and Embedded revenue grew by 19% to $977M.
Strong balance sheet performance continued with GAAP gross margins of 54% and non-GAAP gross margin of 56%. GAAP operating income was at $2B or a 17% margin, non-GAAP operating income at $3.1B representing a 27% margin. GAAP diluted EPS grew by 156% to $1.38 and was$ 1.66, exceeding the analyst estimate of $1.62. Free cash flow outperformed with $1.56B.
The Problem: Margins Stagnating, Not Expanding
The most important concern that the market is pricing in is as follows: AMD's gross margins of 56% non-GAAP are holding steady. With a 50% growth in revenues, market participants expect margin expansion as fixed costs absorb. That is not happening.
Why? Product Mix. As AMD grows its data center revenue (healthy but not outstanding margins), it is eating its own legacy high margin products. Intel’s price pressure is believed to be strong (with its foundry desperation) and may be limiting AMD’s pricing power in CPUs. The $11.5 billion revenue beat is creditable, but it is not helping to generate profit growth that is disproportionate. This shifts the thinking from ‘AI winner’ to ‘AI beneficiary with valuation risk.’
Valuation Remains Stretched at Current Levels
With a current price of $474.21, AMD is trading at approximately 47x forward earnings assuming Street consensus EPS for FY2027. That is expensive for a company with flat gross margins and a data center market that is growing increasingly competitive. The 50% revenue growth is incredible, however it requires excellent execution and sustained pricing power. Investors will punish any deviation from perfection.
AMD Technical Setup: Triangle Breakdown, Support Just Broke, Downside Exposed
There are four main concerns with AMD’s technical analysis on the 2-hour chart. First, price is below the lower triangle support boundaries. This means the stock has broken down out of the large symmetrical triangle. Second, the stock is continuing to report extreme technical selling pressure.
Third, the stock is trading well below both the 50 period moving average at $488.55 and the 100 period moving average at $497.53, reinforcing the overhead resistance between the $488 and the $500 level. Fourth, the stock broke the level of $476.13 in the last trading session and closed at $474.21.
RSI is at the level of 44 and is still below the neutral level of 50. These breakdown levels are now considered downside targets on the price of AMD. The bearish technical outlook also increases the likelihood of a breakdown below the $455.38 level.
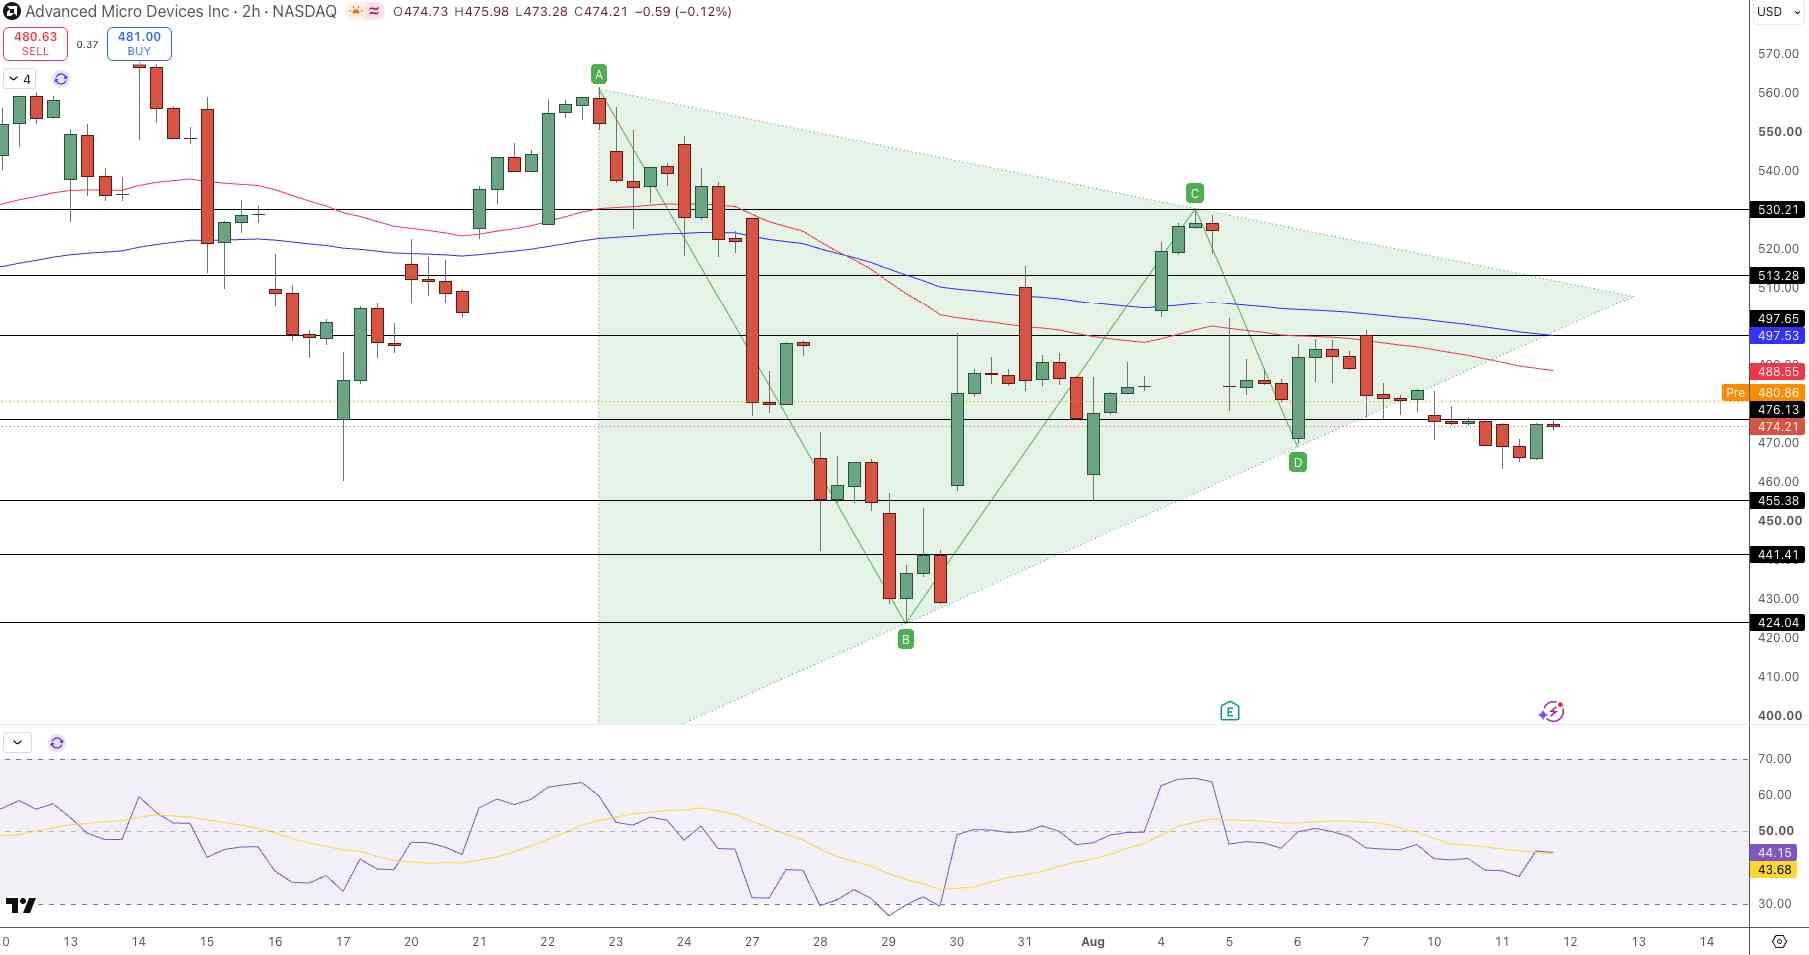
AMD Price Chart - Source: Tradingview
A breakdown here would expose potential levels of $441.41 and $424.04. Buyers would, of course, need to break the $476.13 level in addition to breaking resistance at the $488.55 and $497.53 levels. Above these levels, $513.28 and $530.21 would become important levels for the stock.
Key Levels (Aug 12)
- Broken support: $476.13 (just broke — bearish signal)
- Next downside target: $455.38 (if breakdown accelerates)
- Major floor: $441.41, $424.04
- Resistance cluster: $488.55 (50 EMA), $497.53-$497.65 (100 EMA)
- Extended upside: $513.28, $530.21 (if buyers regain control)
- Current price: $474.21 (below broken support)
- RSI: 44 (bearish, below neutral 50)
Why Is the Stock Falling Despite the Operational Beat?
Two reasons.
First, valuing AMD at 47x forward earnings when the company is showing signs of margin stagnation is risky. The market is saying they will buy into a 50% growth stock, but only if there is margin expansion. It did not happen that way.
Second, the significant run-up in the stock price in the weeks preceding the release created a profit-taking scenario. Third, the competitive threats from Intel and NVIDIA are becoming real as both of those companies are improving in areas where AMD previously had an advantage.
Bottom Line (Aug 12)
AMD's Q2 2026 operational numbers were impressive at $11.5B revenue (+50% YoY), $6.7B Data Center revenue (+107% YoY), gross margins at 56%, and positive cash flow. However, the technical picture is concerning and cannot be ignored. AMD has fallen under $476.13, went under the lower boundary of the triangle and is currently testing $455.38 on the downside.
Valuation issues (47x forward earnings with flat margin trajectory) explain the sell-off. For tactical traders, the technical picture is bearish, $476.13 has been broken. A move below $455.38 would lead to a sell-off in the price of the stock down to the $424 level. For investors, wait and see if gross margins stabilize before buying stock in the $455-$465 price range, or wait for the operational story to encourages buying. The valuation and margin trajectory are not worthy of buying. Disclaimer: this analysis is not investment advice.
Recommended Articles


