


SpaceX Beat Revenue at +92% and Starlink Hit 12M Subs — So Why Is the Stock Targeting $143?
TradingKey - SpaceX (SPCX) 's second quarter results provided clear confirmation of the bull thesis across the board. The stock is responding with a technical breakout to the upside. The stock could be targeting a price of $143.37 with the break up above the multi-week descending channel. Starlink's revenue approached $7.814B with a 92% annual growth rate, more than 1.7 million net subscriber additions and 12 million total subscribers. Starlink is profitable after reaching positive adjusted EBITDA of $3.54 billion with $1.22 billion negative cash flow.
SpaceX just announced they would be building the $16.8 billion Terafab facility in partnership with Tesla, and Argus Research just upgraded it to a ‘Buy’ rating. Looking at the technical side of SpaceX, their stock is breaking the descending channel to the upside, trading above the 50 Day and 100 Day moving averages, and has a Relative Strength Index (RSI) of 74, indicating an overbought market. Investors will have to decide how much they’re willing to pay for Starlink’s revenue growth relative to Tesla and how much they’re willing to pay for SpaceX’s AI infrastructure growth.
The Fundamentals Are Genuinely Strong
Let's use earnings as an example. Starlink recorded $7.814 billion in revenue in Q2, a 92% growth over the same period last year, beating the consensus at $6.9 billion. SpaceX runs three different, and growing, businesses, with Starlink accounting for $4.291 billion of that revenue. Starlink added 1.7 million new customers this quarter to bring its total subscriber count to 12 million.
Starlink also captured $1.8 billion in revenue from government and enterprise customers, which was aided by contracts from Starshield with a $6+ billion commitment. Starlink also recorded $2.591 billion in revenue, a 247% growth over last year, with positive adjusted EBITDA of about $1.15 billion, further establishing that Starlink's high cash expenditures are producing revenue.
The numbers better explained the business. Adjusted EBITDA increased 191% to $3.54 billion. Free cash flow increased to $1.22 billion, and management set the goal to have a final compute of capacity at 2 gigawatts by the end of 2026 (from 1.4 GW at the end of Q3), with $14.1 billion in new cloud agreements signed this quarter, with $6.7 billion in agreements signed in the early part of Q3.
Terafab Is the Game-Changer
On August 6, 2026, SpaceX and Tesla introduced Terafab. This was a $16.8 billion joint venture to design a semiconductor factory in Grimes County, Texas that will span over 100 million square feet. Terafab will integrate logic, memory, packaging, and testing. It will manufacture chips for Tesla's Optimus robots and Cybertrucks, as well as chips for SpaceX's data centers located in space. With the unveiling of Terafab, investors can conclude that the Musk era of fully integrated AI infrastructure has now passed from idea to implementation. SpaceX and Tesla have now invested in Terafab, which shows management's conviction that the company will not outsource its computing needs. In all, SpaceX and Tesla have committed to extending their stack vertically from space to silicon and beyond.
Argus Upgrade Validates the AI Infrastructure Story
Argus Research upgraded SpaceX to Buy on August 7 with a $160 price target. Steven Silver in the rating said the bullish AI infrastructure spending was quickly paying for itself. Silver said he believes ‘less than a year payback’ and said that is very bullish if that is, in fact, the case. The bullish take by the market on SpaceX’s $18.4 billion quarterly outflow would also likely change from ‘a high burn’ to ‘a high return’ from reinvestment.
The Lockup Unlock Was Absorbed Flawlessly
After the first big post-IPO lockup expirations on August 6, most of the time, a huge amount of insider selling ensues. All of that selling did not happen and there was very little selling. 911.5 million shares, $100 billion by current market valuation, were now able to trade. Although most expected that the shares would fall, the stock actually rose, 6% on the day with 255 million shares traded. According to Morgan Stanley’s Adam Jonas, most expected there was little, if any, further upside, but that was proven to be very wrong.
Technical Setup: Channel Breakout Confirmed, $143.37 Next
Positive momentum was set after SpaceX closed above the descending channel that has been limiting price movement since June. From the $105-$110 base, price has spiked to $138.63, now even clearing the prior resistance ($130.63) and crossing the 50-day EMA ($121.81) and 100-day EMA ($122.00). The structure of successive higher lows and higher highs allows a bearish pattern to be replaced with an uptrend.
The current target is $143.37 which, if broken, will confirm a bullish breakout. A break of $143.37 will target $153.68 and $164.62. RSI is at 74, placing SPCX in the overbought region and making a short-term pullback or consolidation likely, but a breach of $143.37 does not remove the bullish breakout possibility.
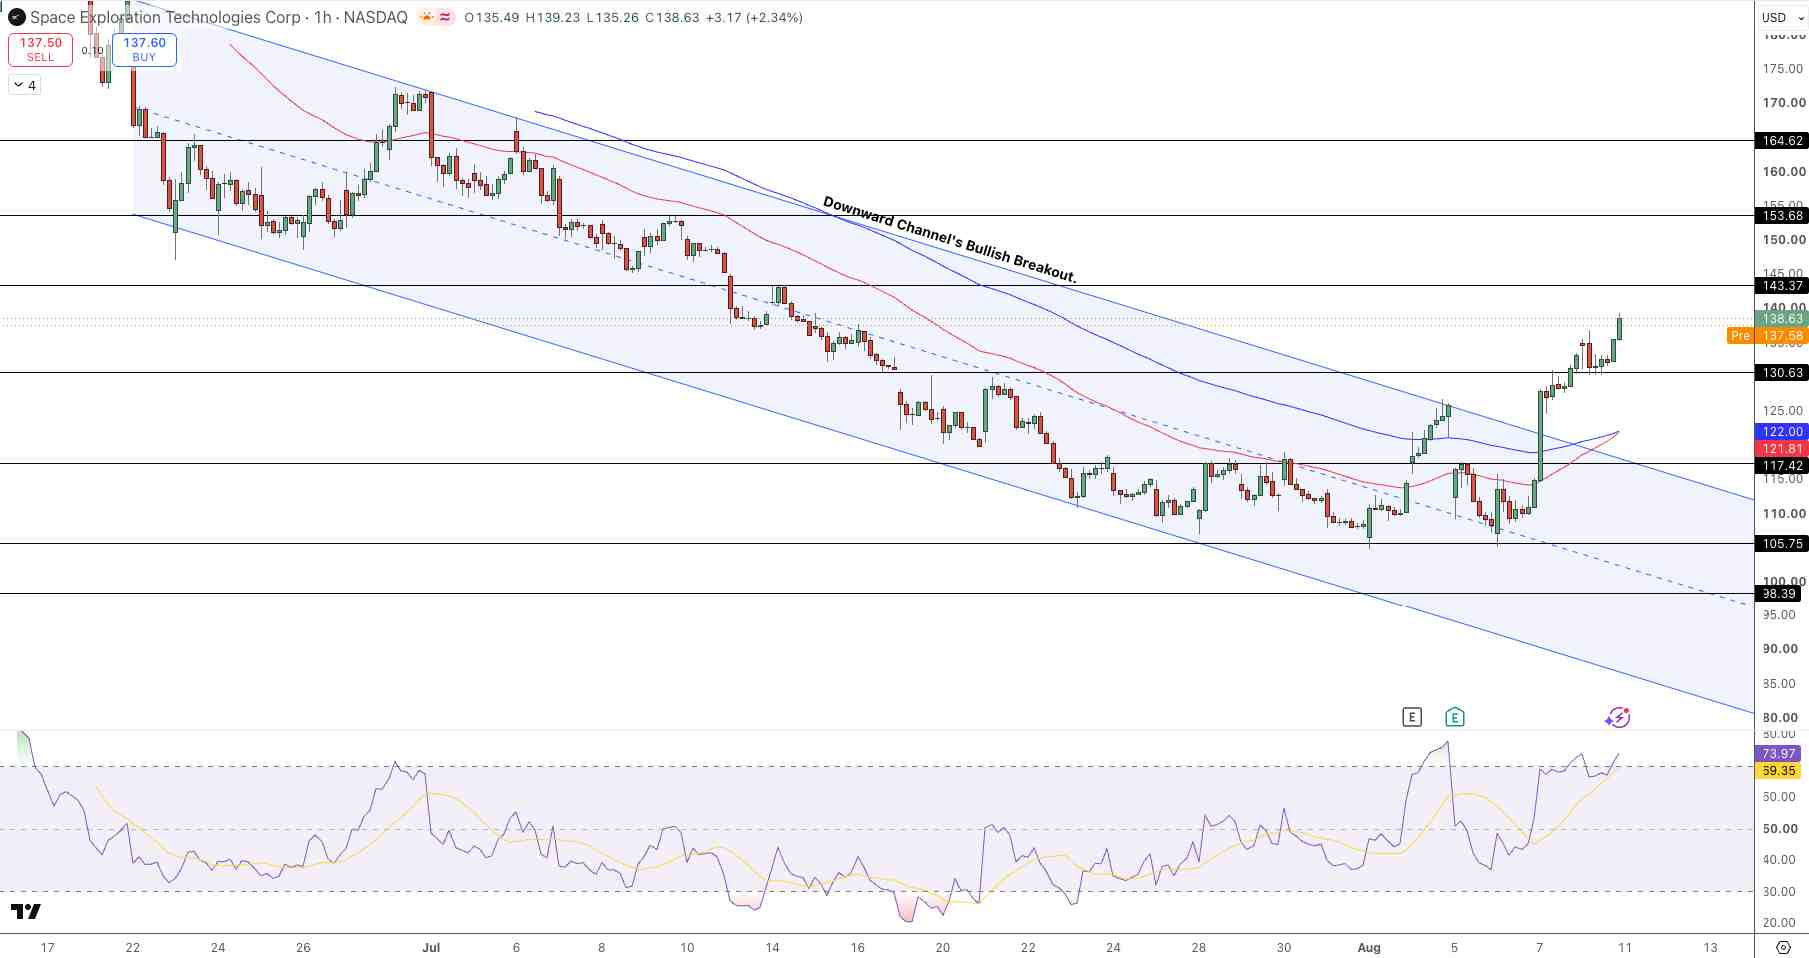
SPCX Price Chart - Source: Tradingview
Should price pull back, resistance is expected at $130.63, prior resistance. Break of this level would negate the bullish breakout, of which the $121.80-$122.00 EMA cluster becomes the next support level. The bias should be bullish until $130.63 is breached. $143.37 is the key level for the recovery and a potential bullish trend.
Key Levels (Sunday Aug 11)
- Immediate target: $143.37 (critical resistance)
- Extended targets: $153.68, $164.62 (if breakout extends)
- Breakout support: $130.63 (must hold)
- EMA support: $122.00 (100 EMA) / $121.81 (50 EMA)
- Secondary support: $117.42, $105.75 (base)
- Current price: $138.63 (above both EMAs)
- RSI: 74 (overbought — consolidation risk)
Why Is the Stock Overbought if the Fundamentals Are Strong?
There are two reasons. The first is that the stock had a large rally in the weeks leading up to the earnings release. This created a base of extended buyers who took profits on the news. The second reason is that on August 4, the stock spiked by 30%, then by an additional 15% on August 10. Short term traders and hedge funds are following the vertical trend and fading the overbought conditions. This is normal after a breakout from a consolidation pattern.
Bottom Line (Sunday Aug 11)
SpaceX's Q2 2026 was stellar. Revenue increased by 92% over Q1 2026. Starlink's subs crossed the 12 million mark and are growing by 1.7 million per quarter. SPCX had an adjusted EBITDA of $3.54 billion, positive free cash flow of $1.22 billion and post-IPO cash raised to $100 billion. The Terafab announcement and Argus upgrade were additional catalysts. The unlocking of the lockup had no effect on the stock, showing that the strong demand is supported.
The technical analysis of SPCX shows a break away from the descending channel with a target price of $143.37. Even though the RSI (Relative Strength Index) shows the price is overbought, bullish momentum can be expected if the target price is reached. Traders should watch the $130.63 support if a pullback is seen. For investors, $130 to $135 would be a better buy price, rather than going over $138.
Recommended Articles


