


Johnson & Johnson Has Increased Its Dividend for 64 Consecutive Years. Here's How Much $10,000 Invested in the Dividend King Pays Annually.
Key Points
Few companies have a longer track record of uninterrupted dividend growth.
This streak is likely to be prolonged well into the foreseeable future.
While still an income stock, Johnson & Johnson is also being priced somewhat like a growth stock.
- 10 stocks we like better than Johnson & Johnson ›
It's certainly not the market's most exciting stock, and not its highest-yielding one either. If you want reliable dividend growth, though, you'd be hard-pressed to find a better option than drugmaker Johnson & Johnson (NYSE: JNJ).
In fact, after 64 straight years of annual dividend increases -- and counting -- only eight other Dividend Kings (companies that have raised their dividends for at least 50 consecutive years) can boast a longer streak of yearly dividend growth.
Missed Nvidia in 2009? This Rare Signal Is Flashing Again. In 2009, a "Double Down" signal flashed for a little-known chipmaker called Nvidia. For the first time in years, that same "Total Conviction" signal is flashing for a company 1/100th the size of Nvidia. Continue »
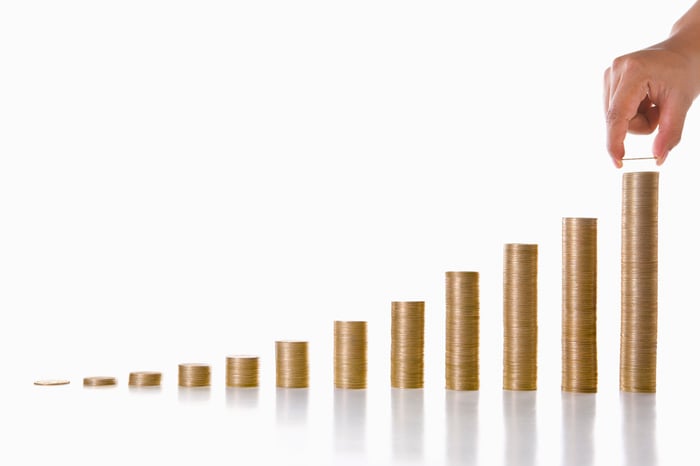
Image source: Getty Images.
This track record's likely to be extended indefinitely, too. Although drugs come and go with their patent protections and expirations, there are always new ways to reload a pharmaceutical company's pipeline and portfolio. Johnson & Johnson, for instance, is aiming for annual oncology drug sales of $50 billion by 2030, making it the biggest name in the cancer treatment business.
In other words, there's enough potential on the horizon for income-minded investors to consider a stake in J&J.
To this end, how much dividend income would a $10,000 position in the pharmaceutical powerhouse produce? That would mean around 39 shares at current prices. With a forward-looking dividend yield currently around 2.1%, this holding would generate close to $210 per year.
That's not a lot; you could certainly find higher-yielding dividend stocks to buy. It's not like Johnson & Johnson's recent dividend growth has been explosive either. It has only improved by 67% over the course of the past decade, for an average of about 5.3% per year. Not bad, but hardly thrilling.
Just bear in mind that J&J has become much more than a mere income investment since 2024, when it first made oncology a priority with a string of acquisitions like Shockwave Medical, Intra-Cellular Therapies, Halda Therapeutics, and, most recently, Firefly Bio. All of this dealmaking makes it a bit more of a growth investment. It's certainly been acting like one, gaining nearly 80% since the end of 2024.
Should you buy stock in Johnson & Johnson right now?
Before you buy stock in Johnson & Johnson, consider this:
The Motley Fool Stock Advisor analyst team just identified what they believe are the 10 best stocks for investors to buy now… and Johnson & Johnson wasn’t one of them. The 10 stocks that made the cut could produce monster returns in the coming years.
Consider when Netflix made this list on December 17, 2004... if you invested $1,000 at the time of our recommendation, you’d have $399,832!* Or when Nvidia made this list on April 15, 2005... if you invested $1,000 at the time of our recommendation, you’d have $1,374,595!*
Now, it’s worth noting Stock Advisor’s total average return is 968% — a market-crushing outperformance compared to 215% for the S&P 500. Don't miss the latest top 10 list, available with Stock Advisor, and join an investing community built by individual investors for individual investors.
See the 10 stocks »
*Stock Advisor returns as of August 9, 2026.
James Brumley has no position in any of the stocks mentioned. The Motley Fool recommends Johnson & Johnson. The Motley Fool has a disclosure policy.
Recommended Articles


