


The Stock Market Is Sending a Chilling Warning, and History Isn't Reassuring
Key Points
The stock market is approaching one of the highest valuation levels ever recorded.
Now more than ever, the quality of your stocks matters.
- These 10 stocks could mint the next wave of millionaires ›
If you've been feeling apprehensive about the stock market lately, you're in the majority. Around three-quarters of American investors said they were concerned about a market downturn in 2026, according to a July survey by MarketWise.
Pessimism about the future of the market isn't unusual: Even in the most bullish runs, fears of a market crash are present. But what is unusual about the current bull run is the historic valuation extreme it's approaching -- one seen only once in the last 150 years.
Missed Nvidia in 2009? This Rare Signal Is Flashing Again. In 2009, a "Double Down" signal flashed for a little-known chipmaker called Nvidia. For the first time in years, that same "Total Conviction" signal is flashing for a company 1/100th the size of Nvidia. Continue »

Image source: Getty Images.
The stock market is approaching its priciest level of all time
The cyclically adjusted price-to-earnings (CAPE) ratio, which divides the price of an index, such as the S&P 500 (SNPINDEX: ^GSPC), by its average inflation-adjusted earnings over the last 10 years, has climbed to a startling level. By one calculation, the CAPE ratio currently sits at roughly 41.4 -- only a few points below the all-time high reached in the dot-com era.
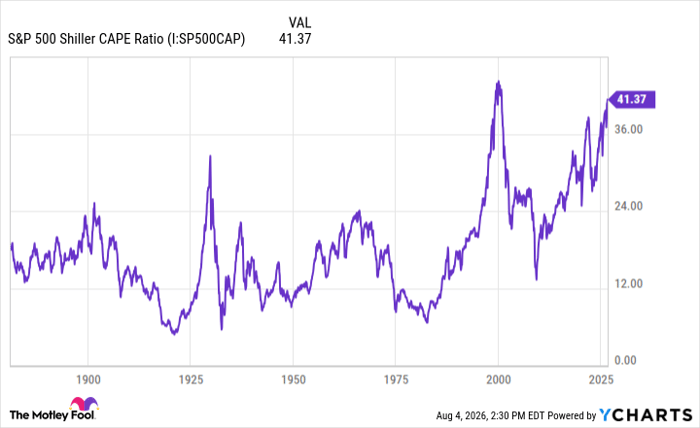
Data by YCharts.
A high CAPE ratio usually indicates that stocks are very expensive, at least by historical standards. For context, the CAPE ratio has averaged about 16 to 17 over the last century and a half, and it has crossed the 30 marker only a handful of times, most notably during the Roaring '20s (i.e., just before the Great Depression) and the tech bubble of the late '90s.
Each time the CAPE ratio has risen steeply in a short period, as the graph suggests, a market decline followed.
If history is sending a warning, how can investors prepare?
If a correction or crash is imminent, the best bear market stocks are those with strong fundamentals. Practically speaking, look for companies with fortress balance sheets: that is, low debt and abundant cash. In addition, these companies should be highly profitable, with steady earnings growth and consistent cash flow.
Companies with predictable earnings are likewise usually more resilient during downturns, even if they seem pretty boring during bull runs. For example, consumer staples stocks tend to perform better in bear markets because people still need to buy necessities, market crash or not. Ditto for healthcare stocks.
It's never a bad idea to diversify your portfolio, too. Rather than investing predominantly in a single sector, spreading money among multiple industries could cushion the blow if one or several areas of the market take a severe hit.
Whatever lies next for the market, history shows the best response is to buy quality stocks for the long term. Though no one knows what's next for the market, holding on to durable businesses through volatility has historically produced strong results.
Where to invest $1,000 right now
When our analyst team has a stock tip, it can pay to listen. After all, Stock Advisor’s total average return is 967%* — a market-crushing outperformance compared to 215% for the S&P 500.
They just revealed what they believe are the 10 best stocks for investors to buy right now, available when you join Stock Advisor.
See the stocks »
*Stock Advisor returns as of August 9, 2026.
Steven Porrello has no position in any of the stocks mentioned. The Motley Fool has no position in any of the stocks mentioned. The Motley Fool has a disclosure policy.
Recommended Articles


