


Robinhood Stock Has Soared 45% From Its 52-Week Low. Here's Why I'm Predicting Another Sell-Off.
Key Points
Robinhood operates a popular investing platform where clients trade stocks, options, cryptocurrency, and more.
The company's recent quarterly revenue growth was driven by heightened trading activity in risky areas of the financial markets.
Robinhood benefited from similar trends in the past, but it ended in disaster for the company and its stock price.
- 10 stocks we like better than Robinhood Markets ›
Robinhood Markets (NASDAQ: HOOD) operates an investing platform where clients can buy and sell stocks, options, futures, cryptocurrency, and event contracts in the prediction markets. Its stock was trading at a 52-week low of $63 in March, a 57% decline from last year's record high of $154.
The sell-off was driven by weakness in Robinhood's options and crypto trading businesses, which combine to make up the bulk of its transaction-based revenue. While options activity recovered slightly during the second quarter of 2026, the crypto business remained subdued.
Where to invest $1,000 right now? Our analyst team just revealed what they believe are the 10 best stocks to buy right now, when you join Stock Advisor. See the stocks »
Robinhood stock has climbed more than 45% from its 52-week low, but here's why I'm predicting another sell-off during the next few months.

Image source: The Motley Fool.
Robinhood's clients engage in very risky behavior
Robinhood generated $1.3 billion in revenue during the 2026 second quarter, an impressive 32% increase from the year-ago period. Transaction-based revenue accounted for $776 million of that total, while net interest income contributed $389 million.
Transaction-based revenue is the money Robinhood earns from its core business, which involves processing trades on behalf of its clients. Options trading was the largest contributor at $342 million, a 29% increase from the year-ago period. Crypto trading revenue, however, plummeted by 38% to just $100 million. That isn't a surprise, given that major coins including Bitcoin and Ethereum are down sharply from their all-time highs, which has kept many investors on the sidelines.
Robinhood also earned $156 million from processing trades in the prediction markets, which clients use to make bets on everything from politics to sports. Like options and crypto markets, prediction markets are extremely risky, and that brings me to a very important point.
During the second quarter of 2021, which was near the height of the pandemic-related frenzy in the financial markets, Robinhood earned a whopping 88% of its transaction-based revenue from options and crypto trading alone. But just one year later, its options revenue was down 31%, while its crypto revenue had plummeted by 75%.
Most investors who engage in highly speculative trading in options, crypto, and prediction markets lose money in the long run, which is terrible for Robinhood's customer retention. In fact, in the company's latest quarterly filing with the Securities and Exchange Commission, it cites speculative "meme" trading as one of the key reasons its revenue fluctuates so erratically.
Transaction-based revenue from areas such as stock investing is more sustainable because buying a slice of a company isn't an all-or-nothing bet, which means clients are likely to stick around for much longer. However, this currently makes up just 17% of Robinhood's total transaction-based revenue.

Image source: Robinhood Markets.
Unfortunately, the composition of Robinhood's revenue leaves the company vulnerable to more volatility in its financial results. When the company's transaction-based revenue fell sharply after 2021, its stock suffered a decline of more than 90%, and there is a risk that history will repeat if it doesn't diversify away from risky areas such as options and event contracts.
Robinhood's lofty valuation opens the door to downside for shareholders
When Robinhood stock set a new record high last October, its price-to-sales (P/S) ratio was more than 30, almost triple its long-term average of 11.9. That valuation wasn't sustainable, but even though the stock has since declined, its P/S ratio remains at an elevated level of 16.5.
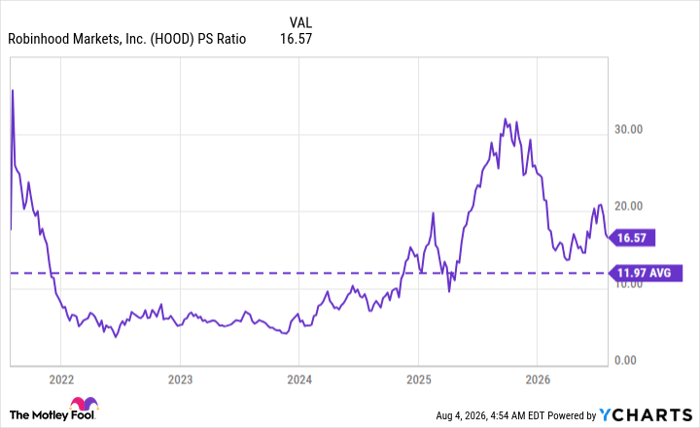
HOOD PS Ratio data by YCharts
That implies Robinhood stock would have to decline by roughly 30% or more just to trade in line with its average P/S ratio of 11.9. However, it might have even more downside potential if there is a decline in the company's transaction revenue, which is a possibility if history is any guide. Lower revenue in the future would mean Robinhood stock might be even more expensive than it currently appears at face value.
A sharp decline in the stock market, rising interest rates, or a deterioration in the broader economy could reduce the disposable incomes of many retail investors who engage in highly speculative trading, thus resulting in lower transaction revenue for Robinhood. All three factors were prevalent last time the company's revenue plummeted in 2022.
Simply put, I think Robinhood's elevated valuation leaves very little room for further upside in its stock, especially considering its largest sources of revenue are on such shaky foundations.
Should you buy stock in Robinhood Markets right now?
Before you buy stock in Robinhood Markets, consider this:
The Motley Fool Stock Advisor analyst team just identified what they believe are the 10 best stocks for investors to buy now… and Robinhood Markets wasn’t one of them. The 10 stocks that made the cut could produce monster returns in the coming years.
Consider when Netflix made this list on December 17, 2004... if you invested $1,000 at the time of our recommendation, you’d have $395,463!* Or when Nvidia made this list on April 15, 2005... if you invested $1,000 at the time of our recommendation, you’d have $1,268,290!*
Now, it’s worth noting Stock Advisor’s total average return is 927% — a market-crushing outperformance compared to 211% for the S&P 500. Don't miss the latest top 10 list, available with Stock Advisor, and join an investing community built by individual investors for individual investors.
See the 10 stocks »
*Stock Advisor returns as of August 5, 2026.
Anthony Di Pizio has no position in any of the stocks mentioned. The Motley Fool has positions in and recommends Bitcoin and Ethereum. The Motley Fool has a disclosure policy.
Recommended Articles


