


Gold advances to one-month high as Hormuz reopening hopes ease inflation fears
- Gold climbs to a one-month high as hopes of reopening the Strait of Hormuz send Oil prices lower.
- Softer energy costs ease inflation concerns, although hawkish Fed expectations could limit further gains.
- XAU/USD challenges the 50-day SMA at $4,160 after reclaiming the 21-day SMA.
Gold (XAU/USD) climbs to a one-month high on Wednesday as renewed optimism over the reopening of the Strait of Hormuz sends Oil prices lower. At the time of writing, XAU/USD trades around $4,155, up nearly 1.90% on the day.
US President Donald Trump said Washington had "very good discussions" with Iran during day-long negotiations on Tuesday. Trump added that the Strait "is going to be open very soon."
Axios reported that the United States, Iran and Oman are nearing an interim deal that could be announced as early as Wednesday. The proposed deal would establish a temporary 60-day arrangement between Iran and Oman to restore shipping.
Strategists at ING note that “lower energy prices have eased some inflation concerns, offering a more supportive backdrop for bullion,” even as investors continue to weigh the policy outlook. They point out that “markets continue to assess the outlook for US monetary policy following last week's Federal Reserve meeting,” leaving Gold “caught between improving geopolitical sentiment and ongoing uncertainty over US interest rates.”
Can Gold move higher from here?
Despite improving market sentiment, the US Dollar (USD) is showing only limited weakness as traders await concrete signs that shipping through the Strait will resume. The US Dollar Index (DXY), which tracks the Greenback's value against a basket of six major currencies, trades flat around 99.85.
US Treasury yields have pulled back from recent highs but remain elevated as broader inflation concerns support expectations that the Federal Reserve (Fed) will keep interest rates higher for longer. All this could keep a lid on Gold’s upside.
A further decline in Oil prices, which could weaken hawkish Fed expectations, may be needed for the yellow metal to extend its rally.
Traders now look ahead to US labour market data, including the ADP Employment Change report later on Wednesday and Friday’s Nonfarm Payrolls (NFP) report, for fresh clues about the Fed’s next move.
Technical analysis: Buyers challenge the 50-day SMA
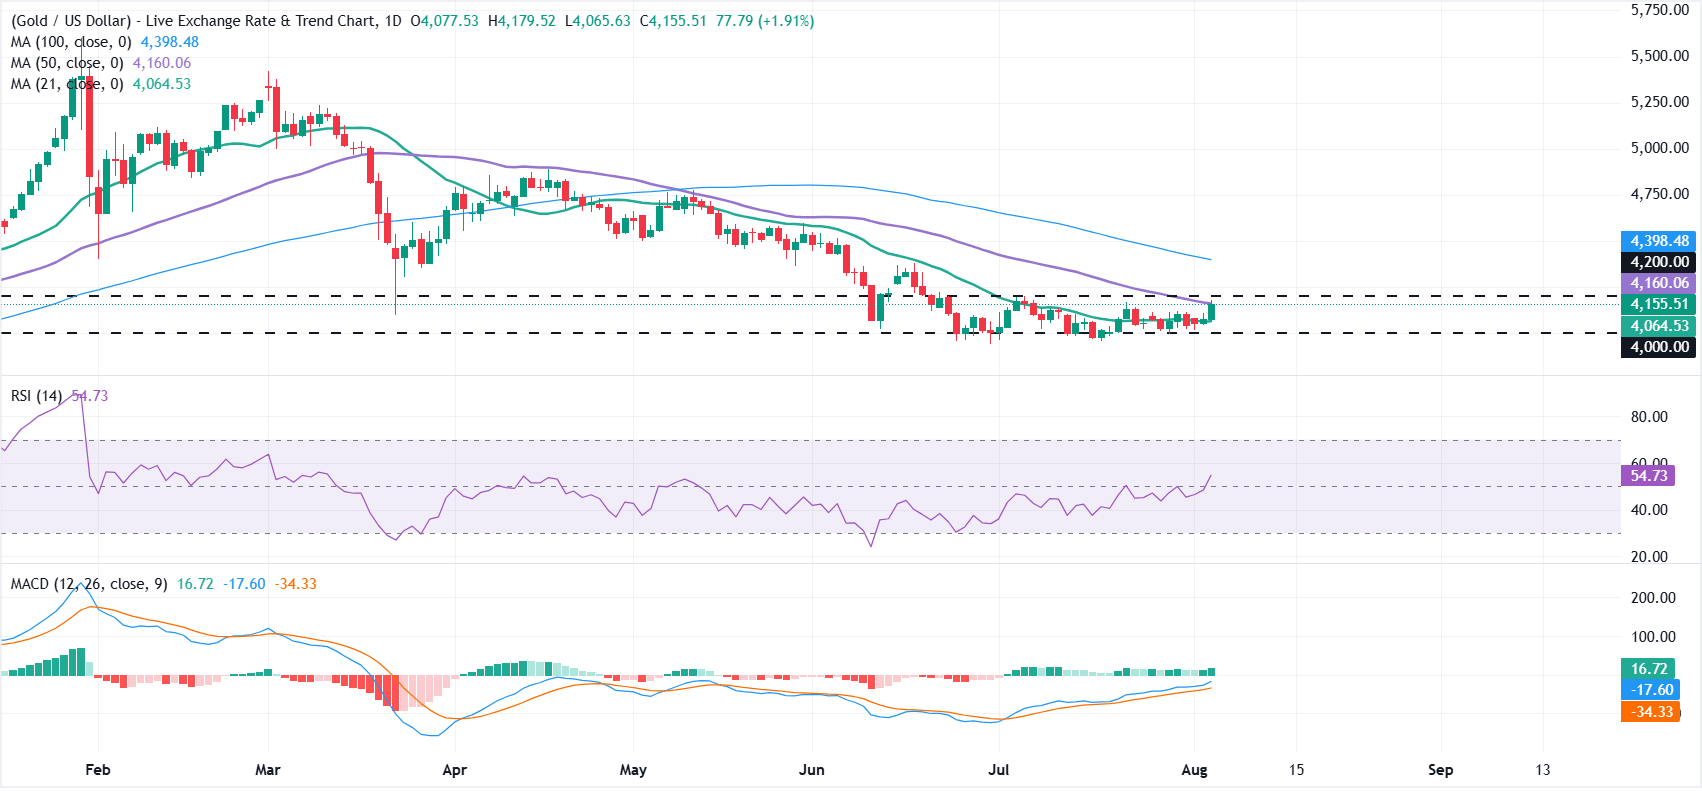
On the daily chart, XAU/USD has pushed back above the 21-day Simple Moving Average (SMA) at $4,064, hinting at a constructive near-term tone, but it remains capped just beneath the 50-day SMA at $4,160, keeping the broader stance neutral rather than outright bullish.
Momentum is improving, with the Relative Strength Index (RSI) around 55 and the Moving Average Convergence Divergence (MACD) in positive territory, suggesting buyers are attempting to regain control while still facing near-term trend resistance.
On the topside, immediate resistance is located at the 50-day SMA at $4,160, followed by the horizontal barrier at $4,200. A daily close above this zone would open the way toward the 100-day SMA near $4,398. On the downside, initial support is provided by the 21-day SMA at $4,064, ahead of the psychological and chart floor at $4,000, where a break lower would signal a deeper corrective phase.
(The technical analysis of this story was written with the help of an AI tool. Know more.)
Nonfarm Payrolls FAQs
Nonfarm Payrolls (NFP) are part of the US Bureau of Labor Statistics monthly jobs report. The Nonfarm Payrolls component specifically measures the change in the number of people employed in the US during the previous month, excluding the farming industry.
The Nonfarm Payrolls figure can influence the decisions of the Federal Reserve by providing a measure of how successfully the Fed is meeting its mandate of fostering full employment and 2% inflation. A relatively high NFP figure means more people are in employment, earning more money and therefore probably spending more. A relatively low Nonfarm Payrolls’ result, on the either hand, could mean people are struggling to find work. The Fed will typically raise interest rates to combat high inflation triggered by low unemployment, and lower them to stimulate a stagnant labor market.
Nonfarm Payrolls generally have a positive correlation with the US Dollar. This means when payrolls’ figures come out higher-than-expected the USD tends to rally and vice versa when they are lower. NFPs influence the US Dollar by virtue of their impact on inflation, monetary policy expectations and interest rates. A higher NFP usually means the Federal Reserve will be more tight in its monetary policy, supporting the USD.
Nonfarm Payrolls are generally negatively-correlated with the price of Gold. This means a higher-than-expected payrolls’ figure will have a depressing effect on the Gold price and vice versa. Higher NFP generally has a positive effect on the value of the USD, and like most major commodities Gold is priced in US Dollars. If the USD gains in value, therefore, it requires less Dollars to buy an ounce of Gold. Also, higher interest rates (typically helped higher NFPs) also lessen the attractiveness of Gold as an investment compared to staying in cash, where the money will at least earn interest.
Nonfarm Payrolls is only one component within a bigger jobs report and it can be overshadowed by the other components. At times, when NFP come out higher-than-forecast, but the Average Weekly Earnings is lower than expected, the market has ignored the potentially inflationary effect of the headline result and interpreted the fall in earnings as deflationary. The Participation Rate and the Average Weekly Hours components can also influence the market reaction, but only in seldom events like the “Great Resignation” or the Global Financial Crisis.
Recommended Articles


