


Is Now the Time for Investors to Pull Money Out of S&P 500 Index Funds?
Key Points
The S&P 500 has been hot for multiple years and may be overdue for a slowdown.
Tracking the broad index is the default option for many investors, but it's by no means the only one.
- 10 stocks we like better than S&P 500 Index ›
The S&P 500 (SNPINDEX: ^GSPC) hit a new record on Tuesday. All is well in the market, it seems, at least for now. However, as investors who have been following the market in recent years know, the mood can change swiftly and without much notice. Inflation, an increase in interest rates, or geopolitical issues could quickly cause the market to go back into a tailspin.
While tracking the S&P 500 through index funds has been an excellent move for investors in the long run, that may not prove to be the case when buying near or at the peak. The stock market has been running hot for multiple years. It has doubled since the start of 2023, when artificial intelligence and ChatGPT injected bullishness into the market.
Where to invest $1,000 right now? Our analyst team just revealed what they believe are the 10 best stocks to buy right now, when you join Stock Advisor. See the stocks »
Normally, it takes seven years for the index to double, assuming it generates returns in line with its long-run average of 10%. Given how hot the rally has been over the past few years, is now the time for investors to consider pulling money out of S&P 500 index funds?

Image source: Getty Images.
Tracking the index has become riskier
For investors who are hanging on for not just years but decades, there may be no reason to pull money out of S&P 500 index funds. The market has always risen over time, and while there will inevitably be crashes along the way, for those who plan to stay invested in the market for the very long haul, even if the S&P 500 does extremely poorly over a few years, it may still prove to be a good move to track the index.
But there is a greater risk these days, which is why relying on index funds may not be a suitable strategy for all investors, particularly those who may need to withdraw funds in the near future or are approaching retirement. In those situations, it may very well make sense to take money out of index funds and into safer investments, such as ones that don't have nearly as much exposure to tech and growth stocks.
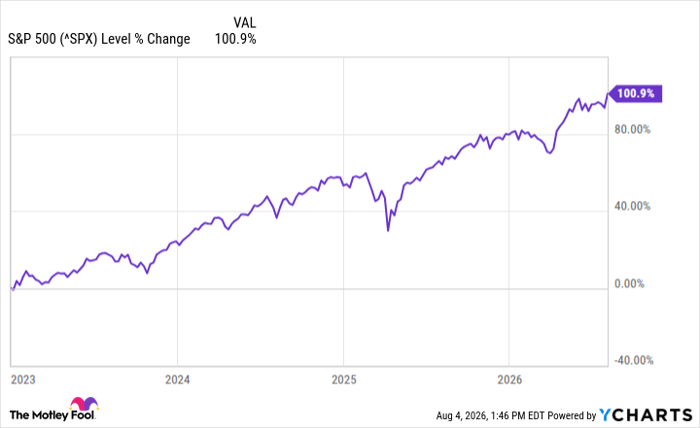
^SPX data by YCharts
There are better value-oriented options than the S&P 500
While the S&P 500 may be the default index for investors, that doesn't mean there aren't safer investment options to consider. Exchange-traded funds (ETFs) that track dividend or value stocks, for instance, may be better alternatives for investors looking for other options.
The good news for investors is that, with many ETFs to choose from, there are plenty that can fit a specific investing strategy.
Should you buy stock in S&P 500 Index right now?
Before you buy stock in S&P 500 Index, consider this:
The Motley Fool Stock Advisor analyst team just identified what they believe are the 10 best stocks for investors to buy now… and S&P 500 Index wasn’t one of them. The 10 stocks that made the cut could produce monster returns in the coming years.
Consider when Netflix made this list on December 17, 2004... if you invested $1,000 at the time of our recommendation, you’d have $395,463!* Or when Nvidia made this list on April 15, 2005... if you invested $1,000 at the time of our recommendation, you’d have $1,268,290!*
Now, it’s worth noting Stock Advisor’s total average return is 927% — a market-crushing outperformance compared to 211% for the S&P 500. Don't miss the latest top 10 list, available with Stock Advisor, and join an investing community built by individual investors for individual investors.
See the 10 stocks »
*Stock Advisor returns as of August 5, 2026.
David Jagielski, CPA has no position in any of the stocks mentioned. The Motley Fool has no position in any of the stocks mentioned. The Motley Fool has a disclosure policy.
Recommended Articles


