

Worldcoin Price Forecast: Soft recovery targets 50-day EMA amid global adoption

Source Fxstreet
  • Worldcoin is up 3% so far on Thursday, extending the rebound from a key support trendline.
  • World’s collaboration with Tinder and Zoom, alongside the introduction of the Concert Kit tool in Europe, reflects demand for its proof-of-human network.
  • The technical outlook is mildly bullish as WLD approaches the bearish confluence of the 50-day EMA at $0.2713 and a descending trendline.

Worldcoin (WLD) edges above $0.2500 on Thursday, extending the 4% gains from the previous day amid World Network’s collaboration with Tinder, Zoom, and its Concert Kit tool in a European concert tour. Still, the technical outlook is cautiously optimistic as the 50-day Exponential Moving Average (EMA) at $0.2713 threatens to cap the recovery. 

Human-only demand for Tinder, Zoom, and European concerts

World Network, in collaboration with Tinder, has launched a Human Badge early experience in Shibuya, Japan. The event will serve as a testing ground with plans to scale globally. For a Human Badge on Tinder, users will require a verified World ID, potentially limiting non-human activity on the platform. Zoom has also partnered to reduce the spread of Deepfakes by verifying identities. 
https://x.com/worldnetworkjp/status/2057081560046977291


On the other hand, the Concert Kit tool by World enters the European market after a pilot phase in Latin America and a private venue in San Francisco, US. THIRTY SECONDS TO MARS will use the kit for selected shows in the United Kingdom and Germany during their 2027 tour so that only verified fans can reserve their tickets.

https://x.com/worldnetwork/status/2057186534982566040

Technical outlook: Will WLD's recovery signal a broader trend reversal?

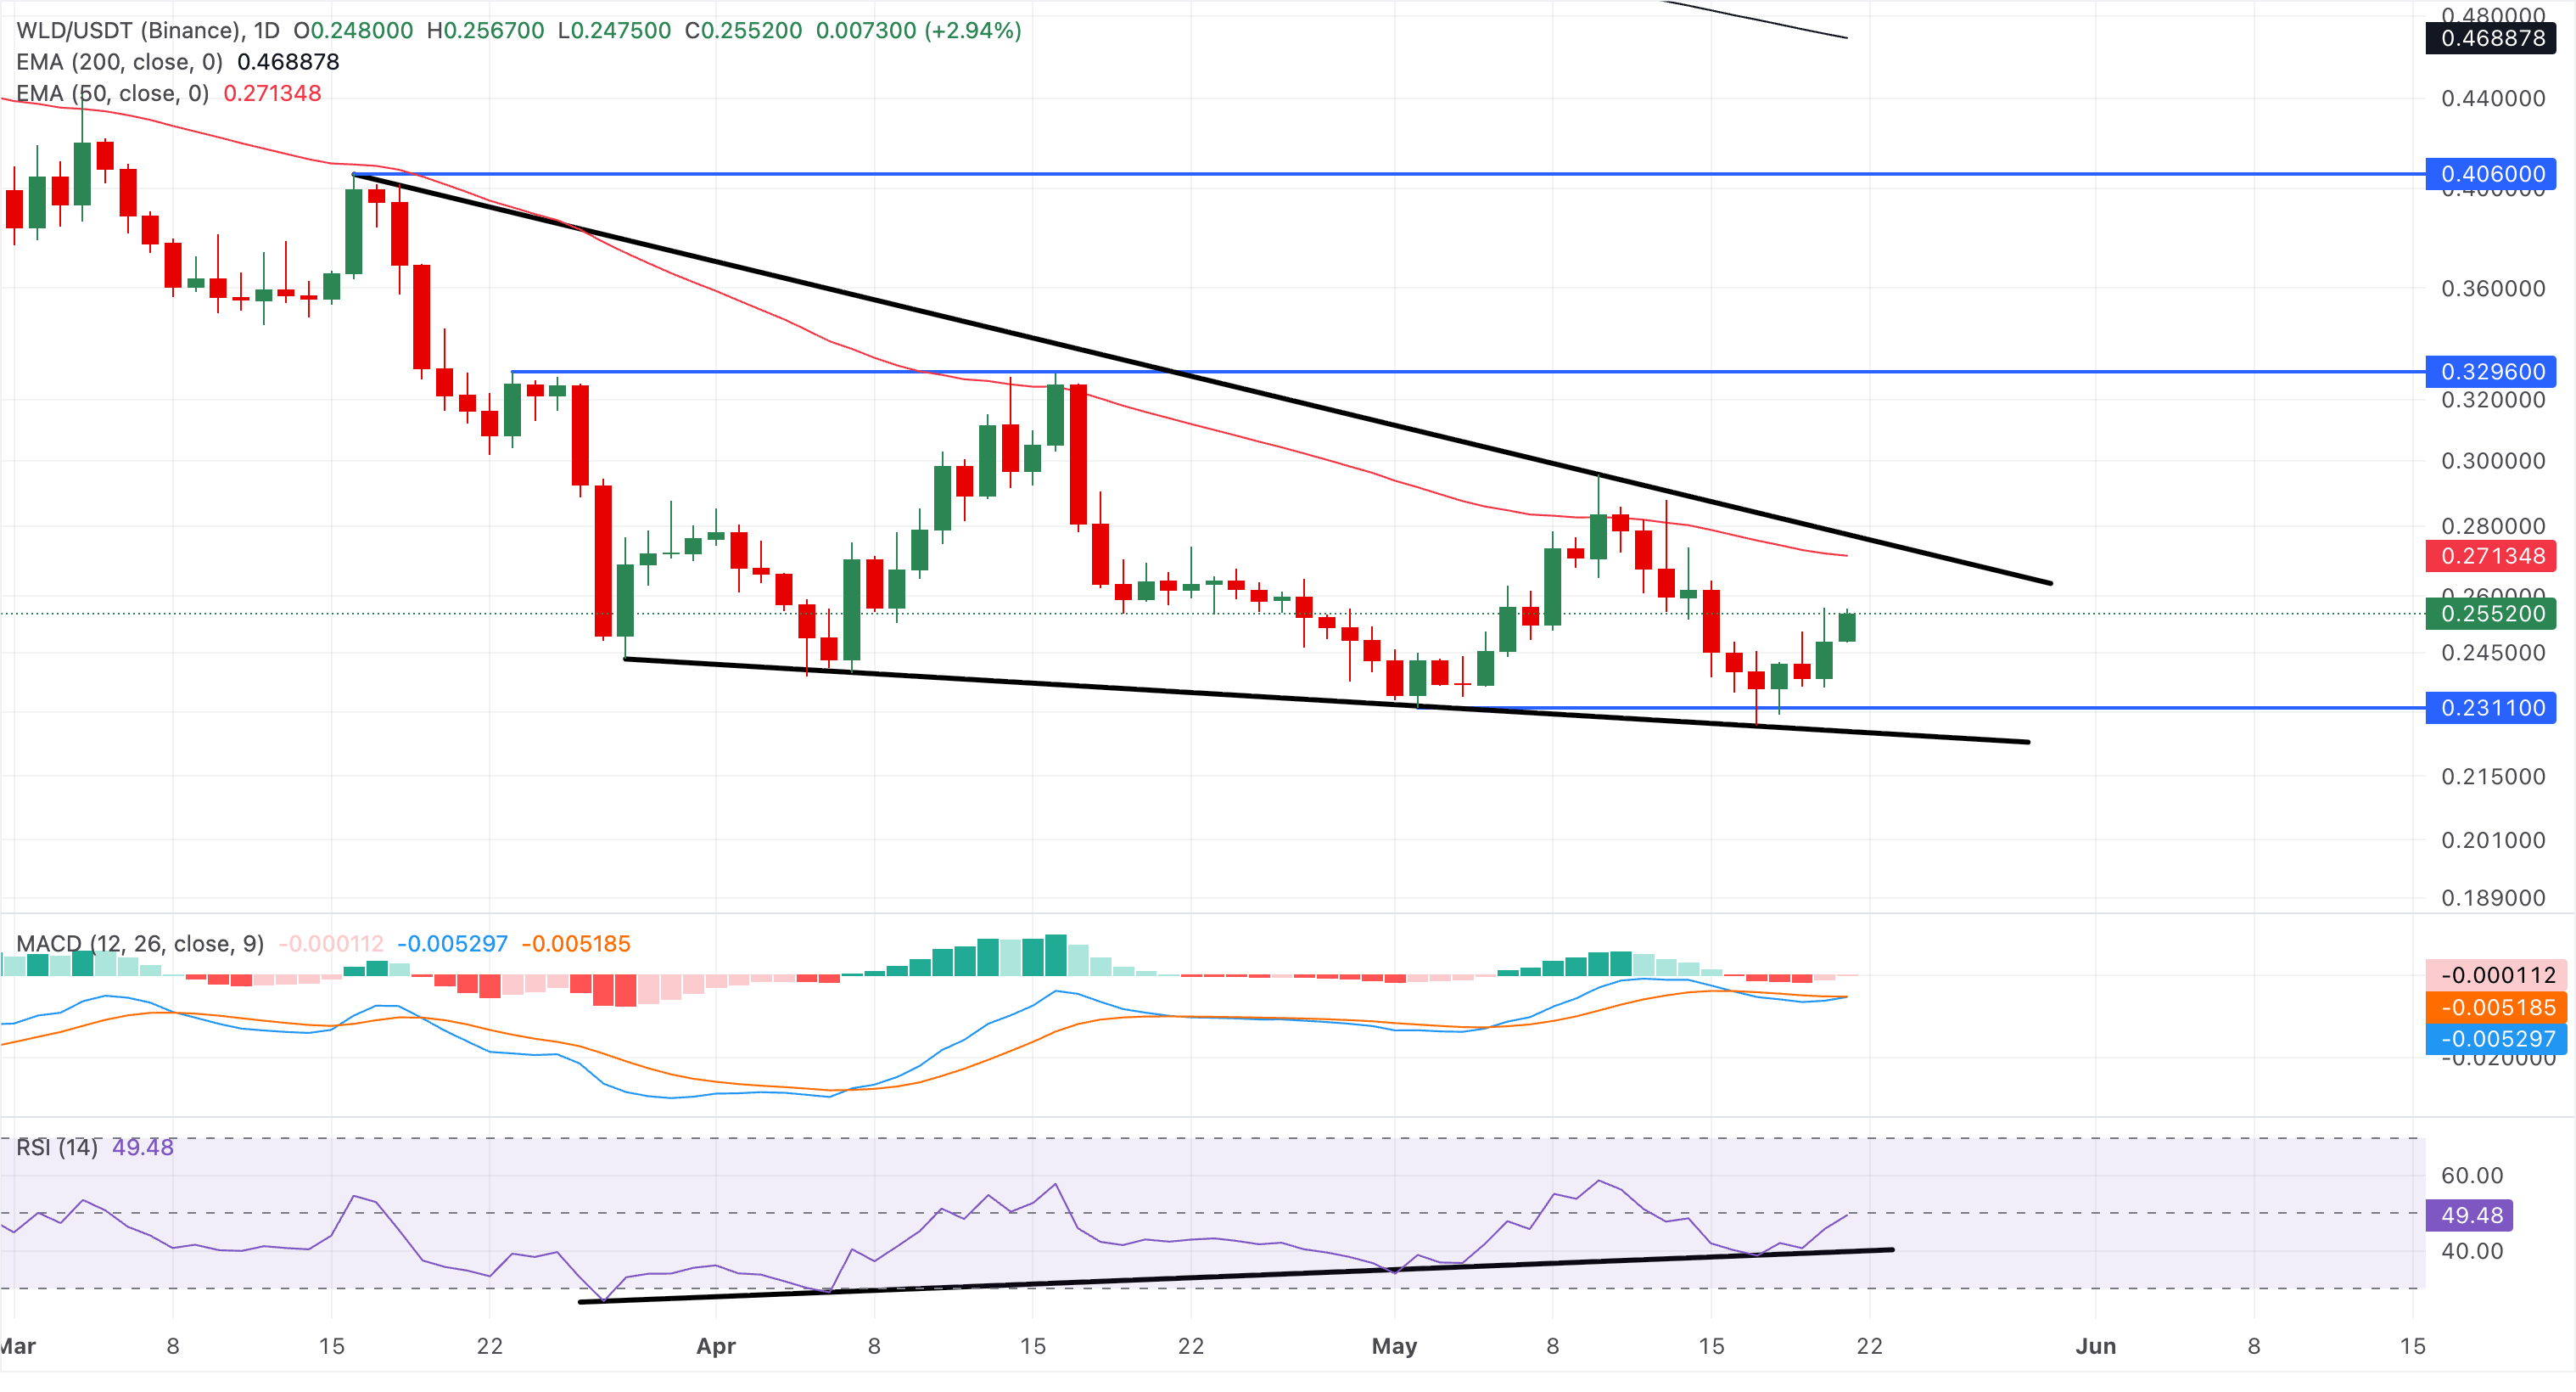
Worldcoin extends gains for the second straight day, extending a rebound from a declining support trendline. The WLD token is capped by a descending trendline at $0.2802, which completes a falling wedge pattern on the daily chart.

Meanwhile, the price remains under the 50-day and 200-day EMAs at $0.2713 and $0.4689, respectively, keeping a bearish near-term tone.

The Relative Strength Index (RSI) around 49 on the daily chart hints at merely stabilizing momentum rather than a bullish shift. However, the steady upward trend in RSI indicates a positive divergence, with the declining trendline supporting the price, typically signaling an upside move. At the same time, the Moving Average Convergence Divergence (MACD) hovers closer to its signal line for a potential bullish crossover, suggesting selling pressure is waning.

On the topside, initial resistance is located at the 50-day EMA near $0.2713, followed by the downtrend-line break area around $0.2802. A daily close above this band would be needed to ease the prevailing downside bias, with the 200-day EMA at $0.4689 marking a far more distant structural barrier.
WLD/USDT daily price chart.

On the downside, the support trendline near $0.2246 remains a key support guarding against a bearish price discovery mode.

(The technical analysis of this story was written with the help of an AI tool.)

Disclaimer: For information purposes only. Past performance is not indicative of future results.
placeholder
XRP Price Prediction for July 2026: Can Buyers Finally Break the Downtrend?XRP (XRP) price trades near $1.05, caught between a year-long downtrend and a sudden burst of buying.July has historically rewarded XRP holders. This year the month arrives with on-chain accumulation
Author  Beincrypto
Jun 30, Tue
XRP (XRP) price trades near $1.05, caught between a year-long downtrend and a sudden burst of buying.July has historically rewarded XRP holders. This year the month arrives with on-chain accumulation
placeholder
What to Expect From Ethereum (ETH) in July 2026Ethereum (ETH) enters July 2026 trading near $1,570, close to multi-month lows, after recording its first run of three consecutive red quarterly candles in its history.On-chain data and price charts n
Author  Beincrypto
Jul 01, Wed
Ethereum (ETH) enters July 2026 trading near $1,570, close to multi-month lows, after recording its first run of three consecutive red quarterly candles in its history.On-chain data and price charts n
placeholder
XAUUSD Gold Analysis: Gold Holds Above $4,350 Ahead of US Inflation Data Is $4,500 Next? Gold holds above $4,350 following weak US jobs data. As inflation reports approach and UBS eyes $5,000, can XAUUSD break resistance at $4,435 to rally toward $4,500?
Author  Naoufal Seddik
Aug 12, Wed
Gold holds above $4,350 following weak US jobs data. As inflation reports approach and UBS eyes $5,000, can XAUUSD break resistance at $4,435 to rally toward $4,500?
placeholder
Gold Price Analysis Today: Gold Drops 1.32% Despite Lower Fed Rate-Hike Bets, Can $4,313 Support Hold? Gold fell 1.32% on August 13 after rising to $4,449.73, then reversing lower and closing near $4,349.918 below the $4,356.46 support. Softer US inflation data reduced Fed rate hike expectations, but selling pressure still dominated the session. Will $4,313 support hold?
Author  Naoufal Seddik
Aug 14, Fri
Gold fell 1.32% on August 13 after rising to $4,449.73, then reversing lower and closing near $4,349.918 below the $4,356.46 support. Softer US inflation data reduced Fed rate hike expectations, but selling pressure still dominated the session. Will $4,313 support hold?
placeholder
Gold Price Analysis Today: Gold Gains 0.94% as Markets Expect Fed to Hold Rates, Can $4,449 Resistance Break? Gold gained 0.94% on August 17, closing near $4,417.30 as softer US data strengthened expectations for unchanged Fed rates in September. Gold remains bullish, with $4,449.730 resistance and $4,310.650 support in focus.
Author  Naoufal Seddik
6 hours ago
Gold gained 0.94% on August 17, closing near $4,417.30 as softer US data strengthened expectations for unchanged Fed rates in September. Gold remains bullish, with $4,449.730 resistance and $4,310.650 support in focus.
Related Instrument
goTop
quote