

Dash Price Forecast: Dash holds above EMAs as bullish recovery builds

Source Fxstreet
  • Dash price extends its recovery, trading above $54 on Tuesday after closing above the 50-day EMA at $52.41 yesterday.
  • Improving derivatives metrics, alongside rising social dominance, hint at strengthening market sentiment.
  • The technical outlook shows improving bullish momentum, suggesting a potential continuation of the recovery.

Dash (DASH), a privacy-focused cryptocurrency, extended its rebound, trading above $54 on Tuesday after gaining over 3% and closing above the key resistance zone the previous day. Improving derivatives metrics and rising social dominance signal strengthening market sentiment. A constructive technical outlook also hints at further gains.

Improving derivatives metrics support a bullish bias

Derivatives data shows improving sentiment among Dash traders. CoinGlass’ funding rates for DASH flipped positive on Saturday and surged to 0.0041% on Tuesday. This indicates longs are paying shorts, reflecting a bullish outlook.
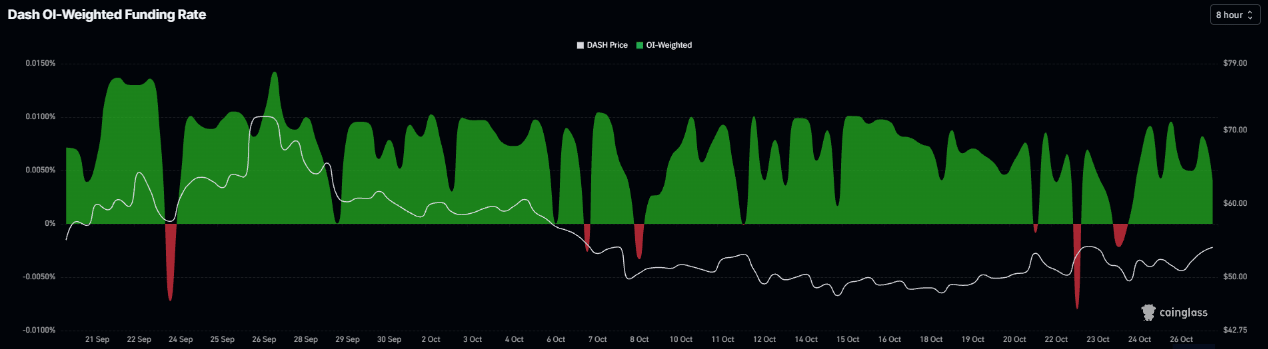
Dash funding rates chart. Source: Coinglass

In addition, CoinGlass’ long-to-short ratio for Dash reads 1.02 on Tuesday. A ratio above one indicates bullish sentiment, as traders bet that asset prices will rise.
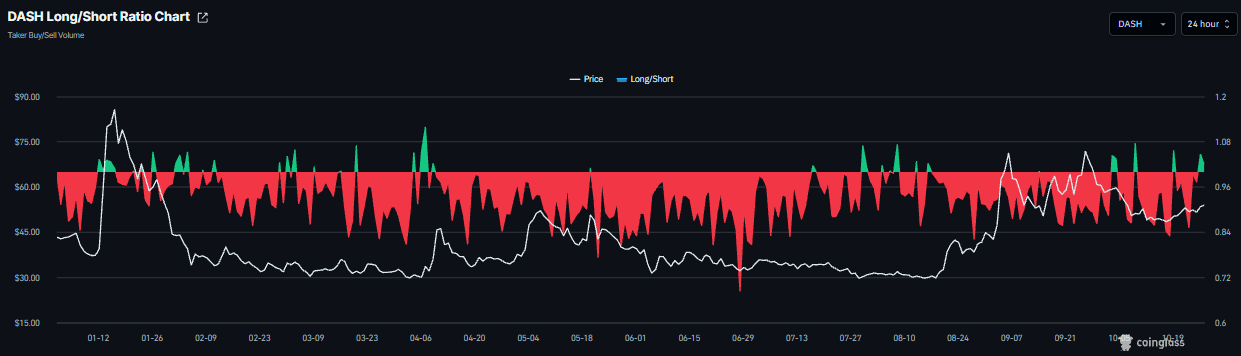
Dash long-to-short ratio chart. Source: Coinglass

Santiment’s Social Dominance metric for DASH also supports a bullish outlook. The index measures the share of DASH-related discussions across the cryptocurrency media. It has been trending upward since mid-October, reading 0.275% on Tuesday, the highest level since mid-September. This rise indicates growing market interest and sentiment among Dash investors, potentially supporting further price recovery.

Dash social dominance chart. Source: Santiment

Dash technical outlook: Improving bullish momentum

Dash price trades at $54.08 on Tuesday, maintaining a mildly bullish near-term bias as it holds above a dense group of Exponential Moving Averages (EMAs). The 50-day EMA at $52.41, the 100-day EMA at $48.95 and the 200-day EMA at $45.07 all sit below the market, suggesting a supportive underlying trend.

Meanwhile, the Relative Strength Index (RSI) around 53 and a positive, rising Moving Average Convergence Divergence (MACD) reinforce improving upside momentum rather than exhaustion.

On the downside, initial support aligns with the 50.0% retracement at $53.82, closely followed by the 50-day EMA at $52.41 and a horizontal level at $52.03, forming a nearby demand cluster before deeper supports emerge at the 100-day EMA near $48.95 and the 61.8% retracement at $47.93.

On the topside, DASH faces next resistance at the 38.2% Fibonacci retracement around $59.72, with a subsequent barrier at the 23.6% retracement near $67.01, where a break higher would open the path toward a more extended bullish phase.
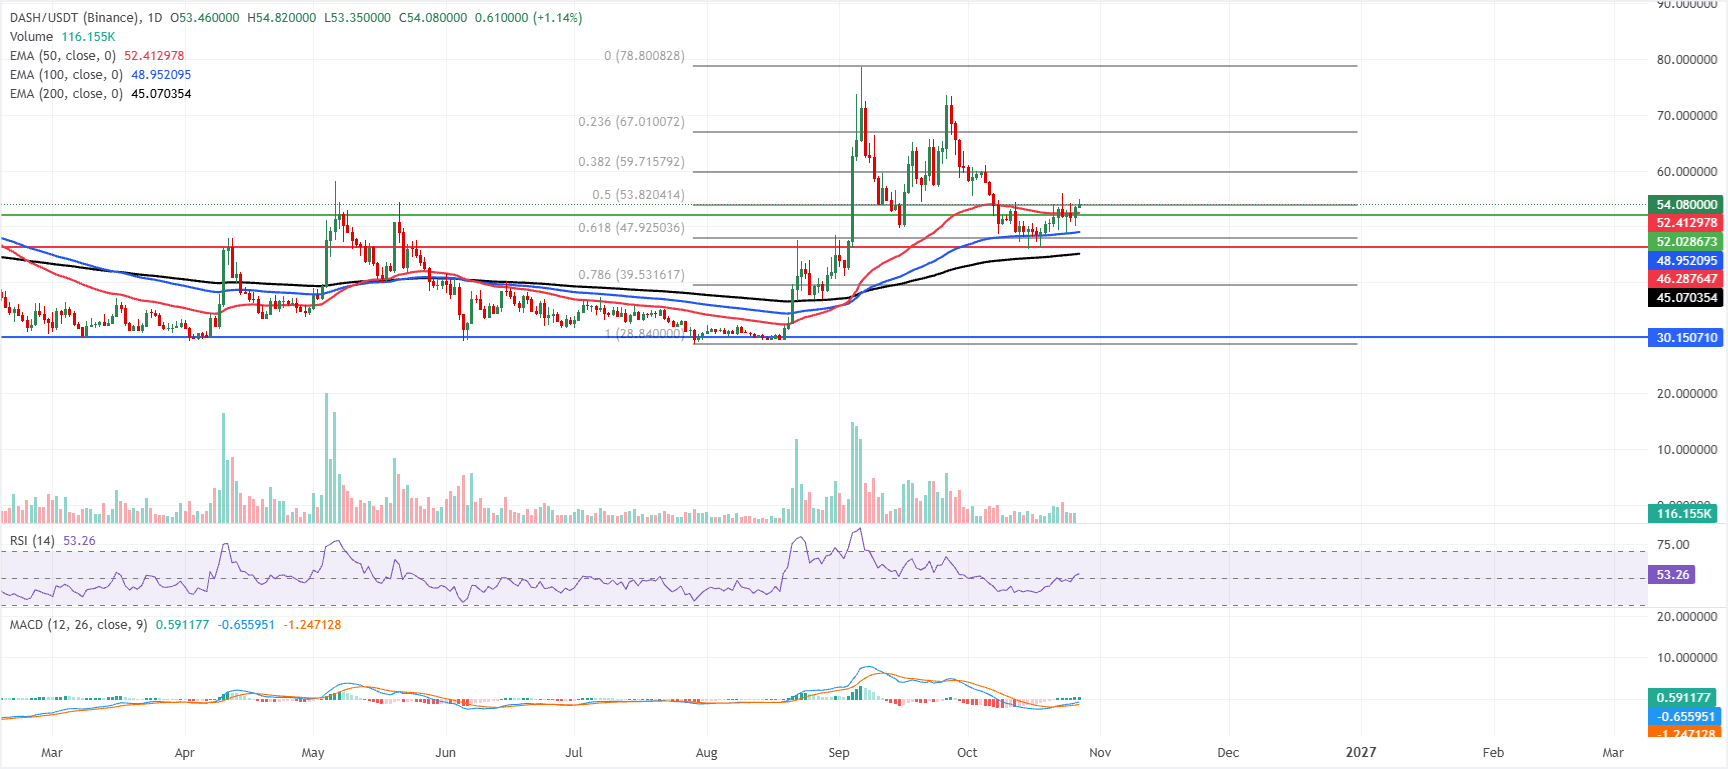
DASH/USDT daily chart

(The technical analysis of this story was written with the help of an AI tool. Know more.)

Disclaimer: For information purposes only. Past performance is not indicative of future results.
placeholder
XAUUSD Gold Analysis: Gold Holds Above $4,350 Ahead of US Inflation Data Is $4,500 Next? Gold holds above $4,350 following weak US jobs data. As inflation reports approach and UBS eyes $5,000, can XAUUSD break resistance at $4,435 to rally toward $4,500?
Author  Naoufal Seddik
Aug 12, Wed
Gold holds above $4,350 following weak US jobs data. As inflation reports approach and UBS eyes $5,000, can XAUUSD break resistance at $4,435 to rally toward $4,500?
placeholder
Gold Price Analysis Today: Gold Drops 1.32% Despite Lower Fed Rate-Hike Bets, Can $4,313 Support Hold? Gold fell 1.32% on August 13 after rising to $4,449.73, then reversing lower and closing near $4,349.918 below the $4,356.46 support. Softer US inflation data reduced Fed rate hike expectations, but selling pressure still dominated the session. Will $4,313 support hold?
Author  Naoufal Seddik
Aug 14, Fri
Gold fell 1.32% on August 13 after rising to $4,449.73, then reversing lower and closing near $4,349.918 below the $4,356.46 support. Softer US inflation data reduced Fed rate hike expectations, but selling pressure still dominated the session. Will $4,313 support hold?
placeholder
Gold Price Analysis Today: Gold Gains 0.94% as Markets Expect Fed to Hold Rates, Can $4,449 Resistance Break? Gold gained 0.94% on August 17, closing near $4,417.30 as softer US data strengthened expectations for unchanged Fed rates in September. Gold remains bullish, with $4,449.730 resistance and $4,310.650 support in focus.
Author  Naoufal Seddik
Aug 18, Tue
Gold gained 0.94% on August 17, closing near $4,417.30 as softer US data strengthened expectations for unchanged Fed rates in September. Gold remains bullish, with $4,449.730 resistance and $4,310.650 support in focus.
placeholder
3 Stocks That Can Benefit From SpaceX’s Surprise Q3 EarningsSpaceX’s latest earnings have given Wall Street a reason to revisit AI hardware stocks. Elon Musk’s company is preparing to spend billions more on computing infrastructure, and three US-listed stocks
Author  Beincrypto
Oct 21, Wed
SpaceX’s latest earnings have given Wall Street a reason to revisit AI hardware stocks. Elon Musk’s company is preparing to spend billions more on computing infrastructure, and three US-listed stocks
placeholder
Today’s Market Recap: Dow Gains Over 1%, SpaceX Surges More Than 8% After Hours, Supermicro Jumps Over 14%, Netflix Falls More Than 5%Tracking the Market TrendTradingKey - As of the close on October 20 Eastern Time, the Dow Jones Industrial Average rose 1.02% to 52,495.88, the Nasdaq Composite slipped 0.02% to 26,424.82, and the S&P
Author  TradingKey
Oct 21, Wed
Tracking the Market TrendTradingKey - As of the close on October 20 Eastern Time, the Dow Jones Industrial Average rose 1.02% to 52,495.88, the Nasdaq Composite slipped 0.02% to 26,424.82, and the S&P
goTop
quote