


Bitcoin Price Forecast: BTC eyes a break above $85,000 as institutional demand returns
- Bitcoin edges higher above $83,000, extending its rebound from the 50-day EMA near $80,786.
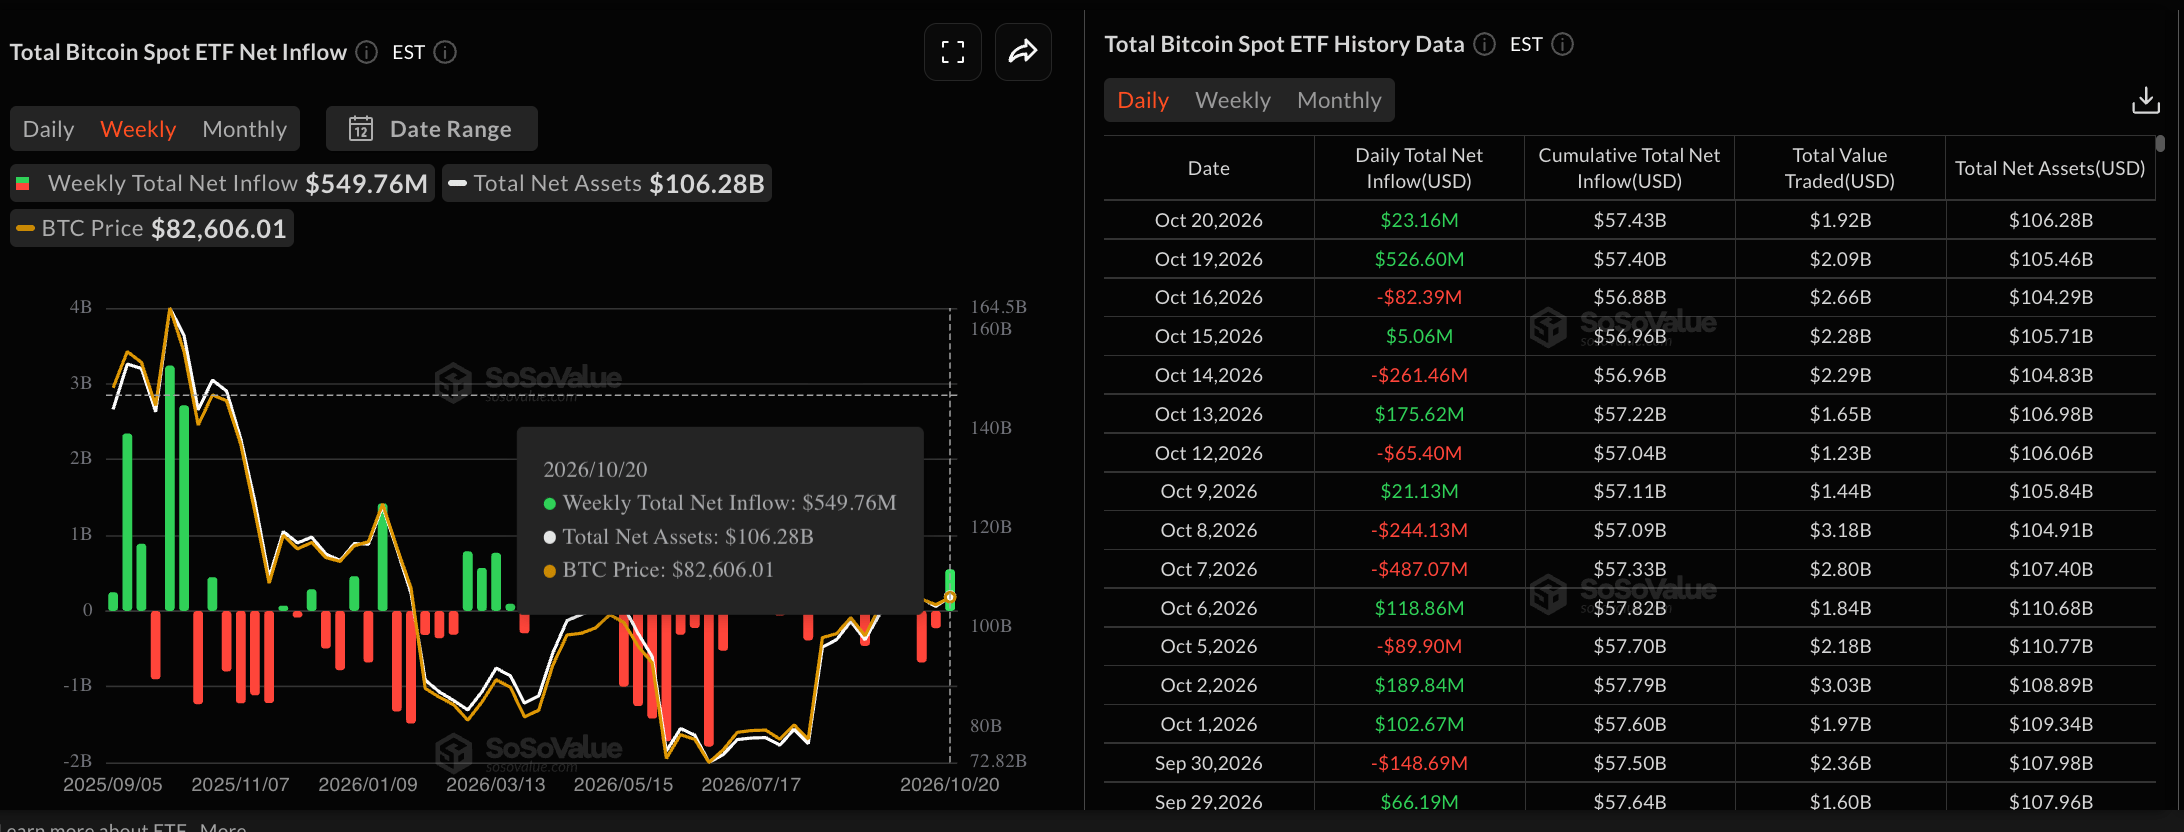
- US-listed BTC spot ETFs recorded over $23 million in net inflows on Tuesday, following Monday's $526 million, signaling a return of institutional demand.
- BTC's technical outlook turns constructive as downside pressure eases and bullish momentum improves.
Bitcoin (BTC) price hovers above $83,000 at press time on Wednesday, showing signs of a bullish comeback as institutional investors regain confidence. US spot BTC Exchange-Traded Funds (ETFs) have recorded nearly $550 million in inflows over the last two days, suggesting renewed buying pressure. The technical outlook for BTC signals further upside potential as bearish momentum wanes.
Institutional investors regain confidence in Bitcoin
Bitcoin spot ETFs see renewed interest from institutional investors. SoSoValue data shows that ETFs recorded $23.16 million in inflows on Tuesday, down from $526.60 million on Monday. The two consecutive days of inflows account for $549.76 million so far this week, up from $228.58 million in outflows last week.
In addition, the Swiss Financial Market Supervisory Authority FINMA has approved a domestic Bitcoin ETF open to retail investors, while prioritizing investor protection and transparency. This reflects the growing integration of BTC funds across major financial markets, which could potentially support capital inflows over time.
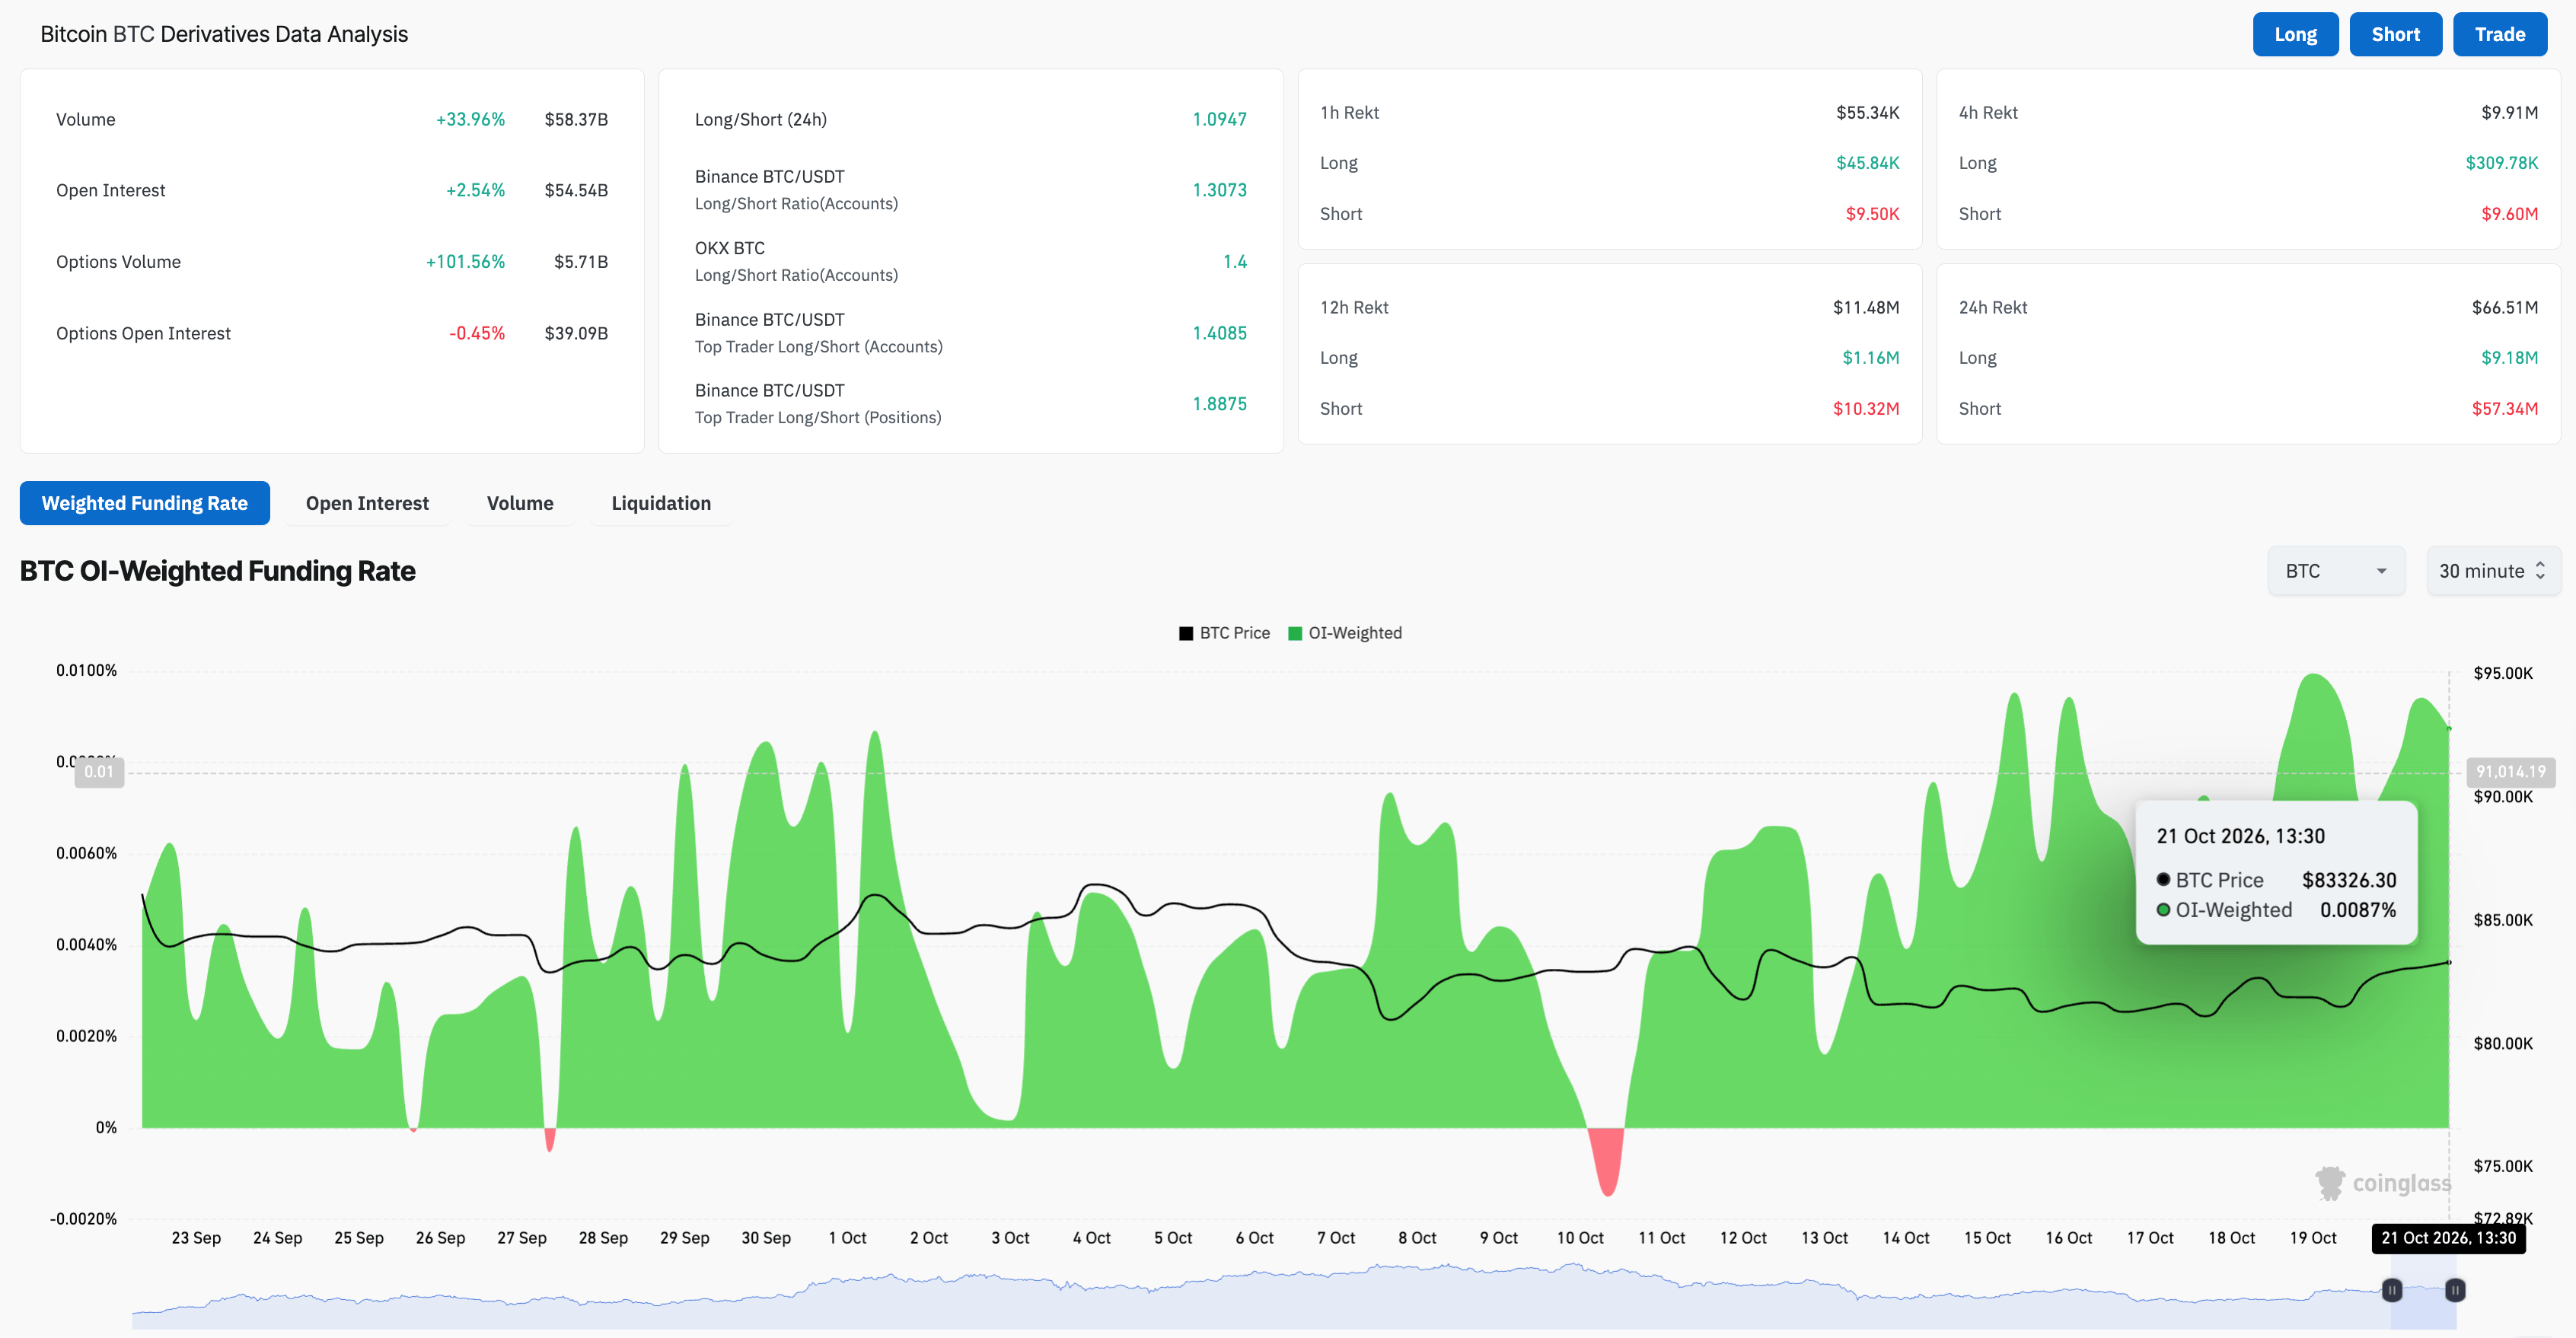
Meanwhile, BTC derivatives data show improving retail confidence. According to CoinGlass, BTC futures Open Interest (OI) is up over 2% in the last 24 hours to $54.54 billion, suggesting an increase in the notional value of active contracts, driven by either positional buildup or rising spot price. Liquidation data shows $66.51 million in positions wiped out over the same period, led by $57.34 million in short positions, implying buy-side dominance and supporting the odds of a positional buildup.
The OI-weighted funding rate of 0.0087% remains positive, suggesting that traders are willing to pay a premium to go long, reflecting their upside bias.
Technical outlook: Will Bitcoin reclaim $85,000?
Bitcoin trades around $83,382 on Wednesday, retaining a constructive bullish bias above the 50-day Exponential Moving Average (EMA) at $80,787. The 200-day EMA around $76,112 underpins a long-term bullish trend.
The King Crypto is also trading above the 50% Fibonacci retracement level at $81,182, measured from the previous upswing from $74,967 to $87,395 in mid-September, reinforcing the ongoing uptrend.
Momentum indicators on the daily chart suggest easing headwinds. The Moving Average Convergence Divergence (MACD) line remains marginally below its signal line as the negative histogram wanes, while the Relative Strength Index (RSI) at 54 rises above the midline.
On the topside, immediate resistance is seen at the $87,396 swing high, and a sustained breakout above this level could target the $90,000 round figure, followed by the 161.8% Fibonacci extension level at $95,075.
Looking down, initial support is at the 50% retracement level at $81,182, reinforced by the 50-day EMA at $80,787, with deeper demand expected at the 200-day EMA at $76,112.
(The technical analysis of this story was written with the help of an AI tool. Know more.)
Recommended Articles


