


We Are Witnessing the Stock Market Do Something for Only the 2nd Time in 155 Years, and History Is Clear About What Comes Next
Key Points
The CAPE ratio and Buffett indicator suggest stocks are expensive by historical standards.
High valuations can signal weaker long-term returns without predicting an imminent crash.
Investors should lower their return expectations while staying invested and continuing to buy.
- 10 stocks we like better than S&P 500 Index ›
The S&P 500 (SNPINDEX: ^GSPC) is still up about 12% this year, but the ride for investors has gotten a bit rougher lately. After setting a record earlier this month, the index has fallen nearly 2% as sticky inflation and rising bond yields spook investors.
And the tech-heavy Nasdaq Composite (NASDAQINDEX: ^IXIC) took an even bigger hit, dropping more than 4% from its high. Those rising yields hit high-growth tech stocks -- especially those that are tapping debt markets more and more -- harder. The sustainability of the artificial intelligence spending boom is keeping Wall Street on edge, especially given that stocks are very expensive by historical standards.
Missed Nvidia in 2009? This Rare Signal Is Flashing Again. In 2009, a "Double Down" signal flashed for a little-known chipmaker called Nvidia. For the first time in years, that same "Total Conviction" signal is flashing for a company 1/100th the size of Nvidia. Continue »
The Shiller CAPE ratio, one of the most widely followed measures of stock market valuation, has now been floating above 40 for a few months. That's only happened once before in 155 years of stock market data: during the peak of the dot-com bubble.
That's not exactly a comparison that inspires confidence.
What the CAPE ratio tells us
Short for cyclically adjusted price-to-earnings ratio, the CAPE compares the S&P 500's price with its average (inflation-adjusted) earnings over the previous 10 years. While a simple P/E ratio can make stocks look unusually cheap or expensive depending on whether businesses just had a great year or a terrible one, zooming out to a decade average removes the noise and helps give a clearer picture of what's actually going on.
The CAPE's long-term average is roughly 17.4. Today's reading is well over twice that. Its all-time high came in December 1999, when it reached 44.2. A few months later, the dot-com bubble burst, and the stock market began its precipitous decline, eventually losing nearly half of its value.
Check out the CAPE over time in the chart below.
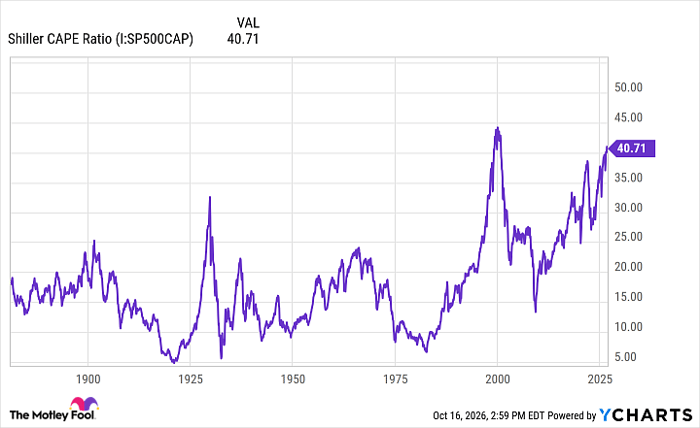
Shiller CAPE Ratio data by YCharts
Buffett's valuation warning
The CAPE isn't the only metric reaching worrying levels. Looking at the value of the U.S. stock market versus the gross domestic product (GDP) of the U.S., a measure popularized by investing legend Warren Buffett, we can see that things are looking pricey. Today, it stands at around 244%. In other words, stocks are worth more than twice what the U.S. economy produces in a year.
In the aftermath of the dot-com bubble, when the indicator had reached as high as 190%, Buffett famously told investors that when the ratio approaches 200%, "you are playing with fire."
Why today's market could be different
To be fair, there are reasons to take both readings with a grain of salt:
- U.S. businesses can earn income abroad, and over time, more have expanded their global operations. That means that a substantial part of a given company's stock value today comes from economic output that isn't counted in U.S. GDP.
- The smoothed-out nature of the CAPE ratio is a double-edged sword. If AI delivers a lasting boost to corporate profits, today's stock values will look more reasonable over time.

Image source: Getty Images.
And that last part is an important distinction between the late 90s and today: Much of the dot-com bubble's stock market craze centered on companies with very little in the way of actual earnings. That's not true of the big names driving the stock market higher today.
Lower your expectations, but stay invested
Still, I wouldn't dismiss these warning signs. It's hard to look at today's market and not see it as frothy, regardless of the ever-increasing earnings of companies like Nvidia and Alphabet.
But it's important to understand what the historical record actually tells us. The CAPE is a really good tool to get a general sense of returns over time. It is not a crystal ball that can tell us if and when a crash is coming. With the CAPE above 40, I would adjust my expectations of returns over the next decade; I wouldn't take it as a guarantee that a crash is imminent. History suggests that the stock market will probably underperform over the next decade.
But it also tells us that, in the long run, the stock market remains the best wealth-generating tool in history. And those who remain invested, keep a level head, and continue buying whichever direction the market moves will be rewarded.
Here's something to think about: If you invested $1,000 into an exchange-traded fund that tracks the S&P 500 at the worst possible moment of the dot-com bubble -- at the very peak on March 24, 2000 -- you would have more than $5,000 today before accounting for dividends.
Should you buy stock in S&P 500 Index right now?
Before you buy stock in S&P 500 Index, consider this:
The Motley Fool Stock Advisor analyst team just identified what they believe are the 10 best stocks for investors to buy now… and S&P 500 Index wasn’t one of them. The 10 stocks that made the cut could produce monster returns in the coming years.
Consider when Netflix made this list on December 17, 2004... if you invested $1,000 at the time of our recommendation, you’d have $376,696!* Or when Nvidia made this list on April 15, 2005... if you invested $1,000 at the time of our recommendation, you’d have $1,333,920!*
Now, it’s worth noting Stock Advisor’s total average return is 925% — a market-crushing outperformance compared to 212% for the S&P 500. Don't miss the latest top 10 list, available with Stock Advisor, and join an investing community built by individual investors for individual investors.
See the 10 stocks »
*Stock Advisor returns as of October 21, 2026.
Johnny Rice has no position in any of the stocks mentioned. The Motley Fool has positions in and recommends Alphabet and Nvidia. The Motley Fool has a disclosure policy.
Recommended Articles


