

Cardano Price Forecast: ADA risks 15% downside as retail demand, bullish momentum wane

Source Fxstreet
  • Cardano holds steady around $0.2200 on Monday after facing a 12% decline last week.
  • Derivatives data shows declining Open Interest and a fluctuating funding rate, implying weak retail demand.
  • The technical outlook for ADA is bearish, pointing to nearly 15% downside potential toward the $0.1894 support level.

Cardano (ADA) is trading above $0.2200 at press time on Monday, holding steady after a 12% decline the previous week. The altcoin is losing retail interest as the notional value of active ADA futures positions declines. The technical outlook for ADA suggests a downside bias following the bearish breakout below a near-term support trendline last week.

Is Cardano losing retail support?

Cardano maintains a corrective tone, with a decline of over 10% so far in October, capping retail speculation. CoinGlass data shows the ADA futures Open Interest (OI) is declining, down to $475.58 million on Monday, from $549.14 million last week. This indicates a significantly reduced notional value of active contracts, linked to a declining spot price or positional wipeout.

At the same time, the funding rate stands at 0.0032%, reflecting a bullish bias among traders, anticipating a rebound, although the downside risk persists and increases the risk of a long squeeze.
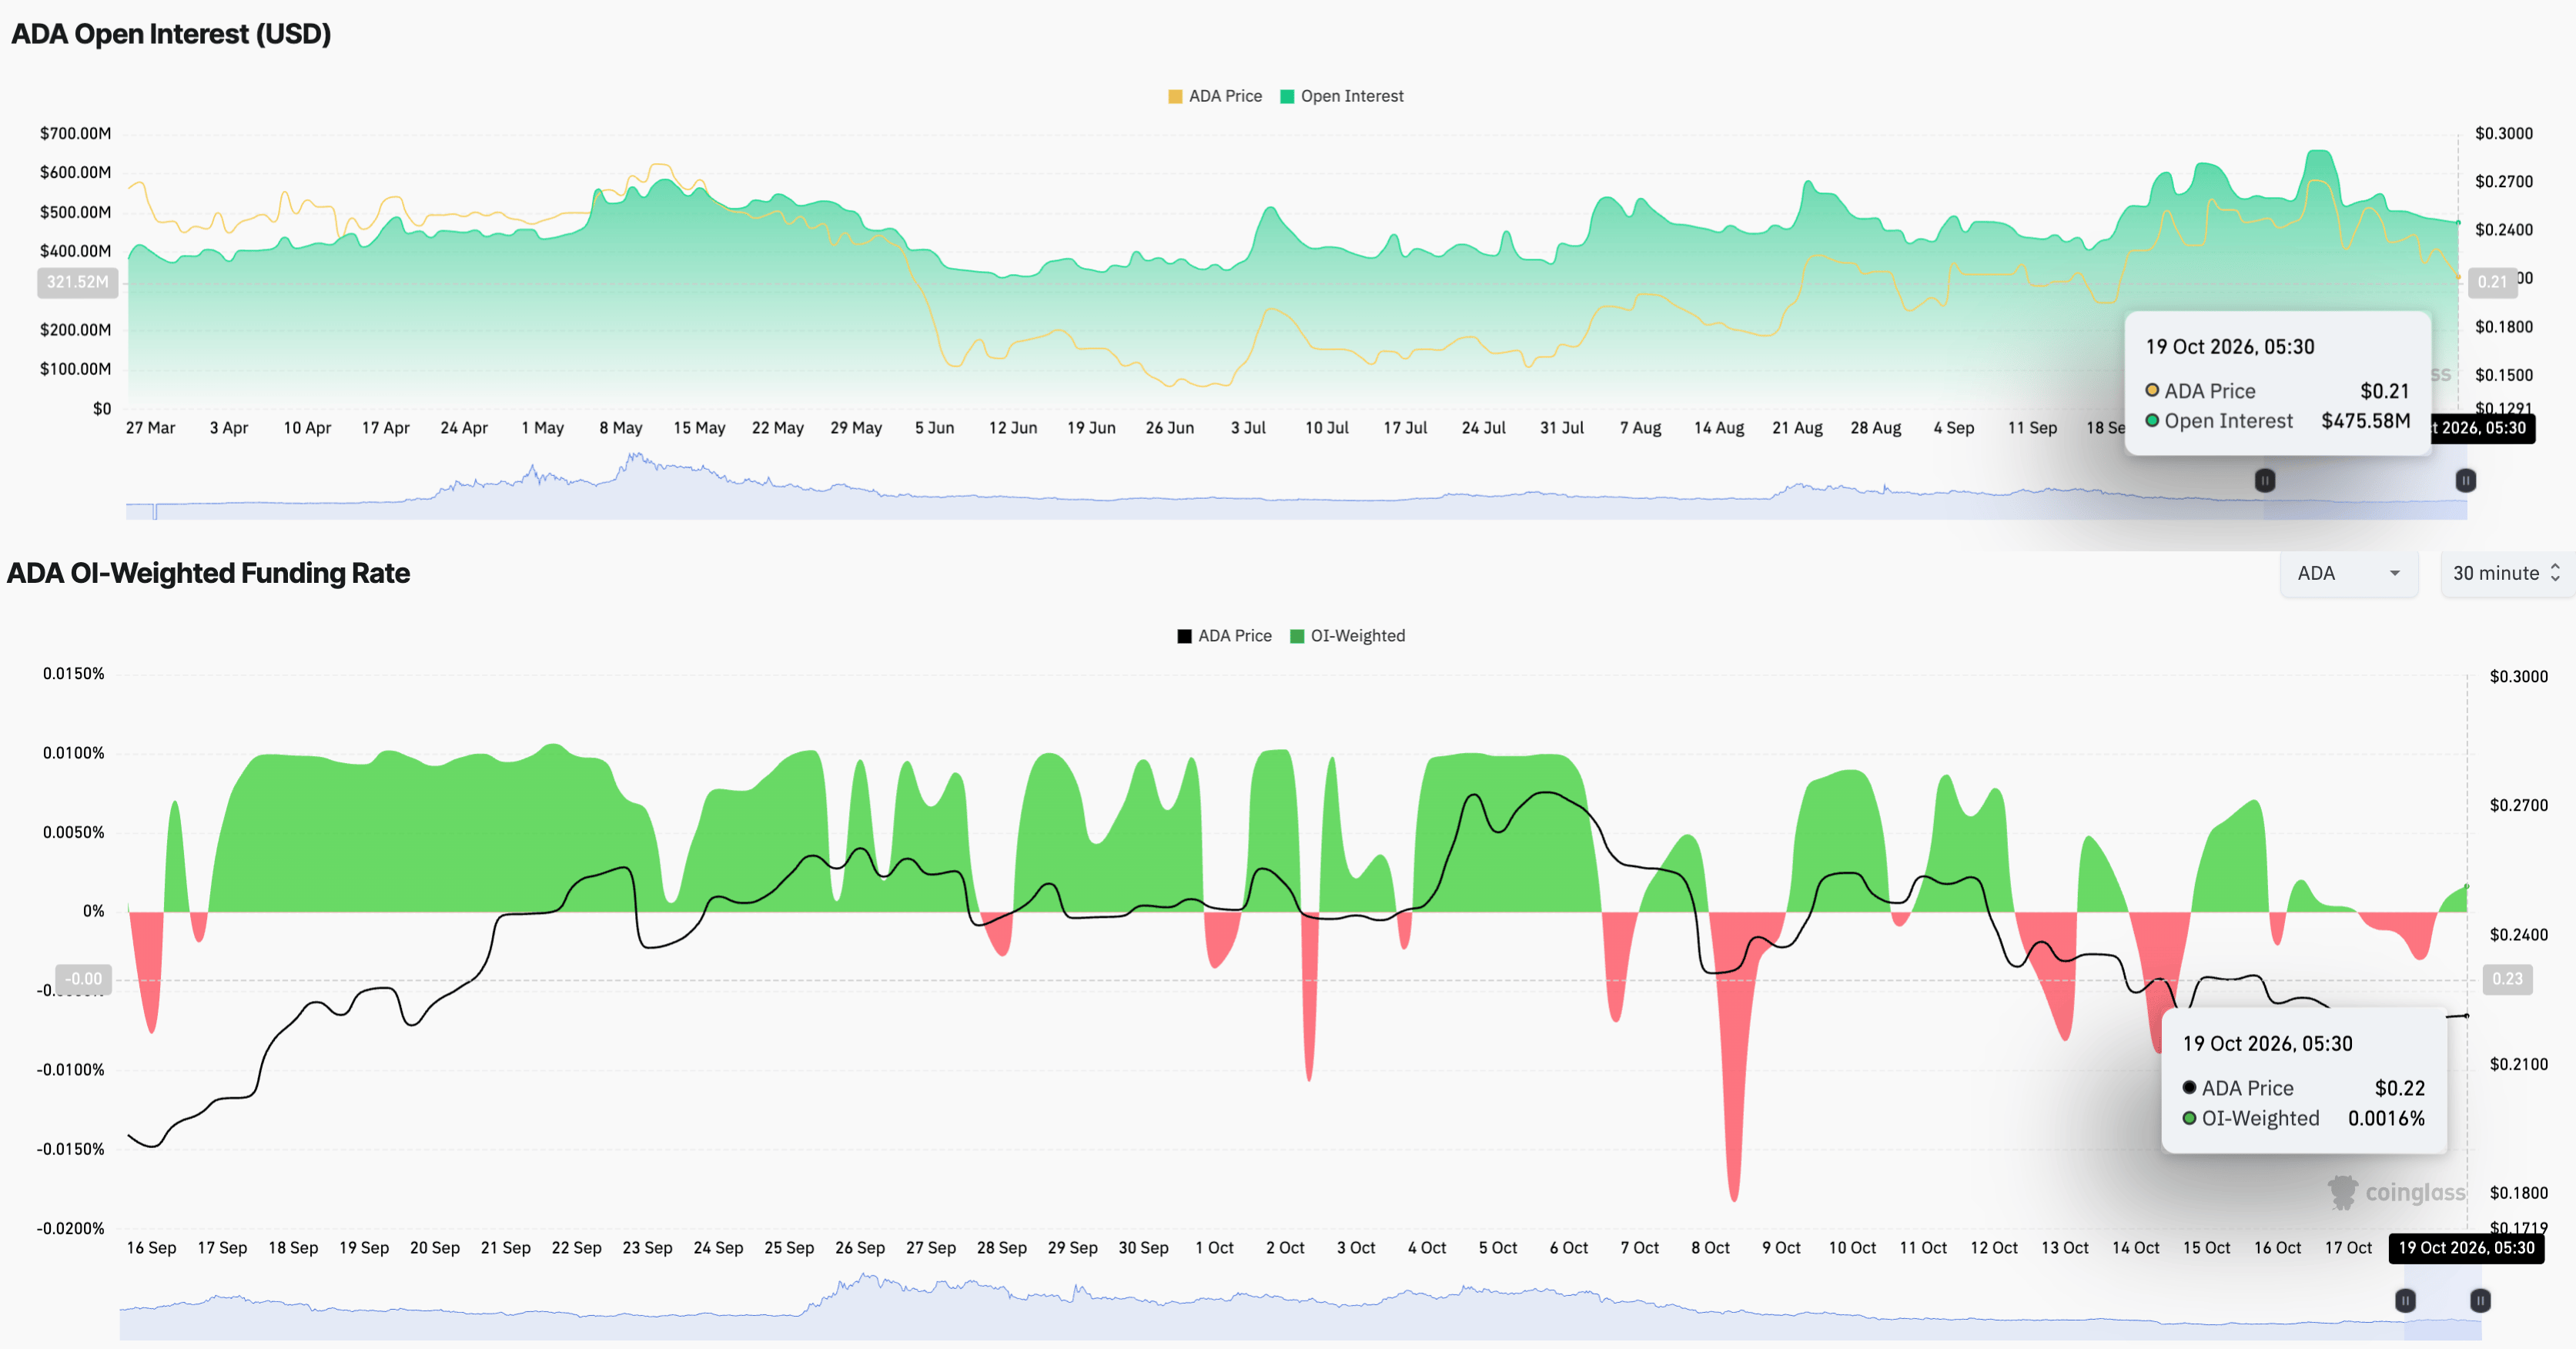
ADA derivatives data. Source: CoinGlass

On the other hand, Cardano’s large-wallet investors, commonly referred to as whales, remain muted. Santiment data shows investors holding over 100 million ADA tokens account for 15.99% of the circulating supply, marginally up from 15.95% last week, while the cohorts holding 10 million to 100 million tokens have stabilized at 38.11%, down from 38.27% in the same period.
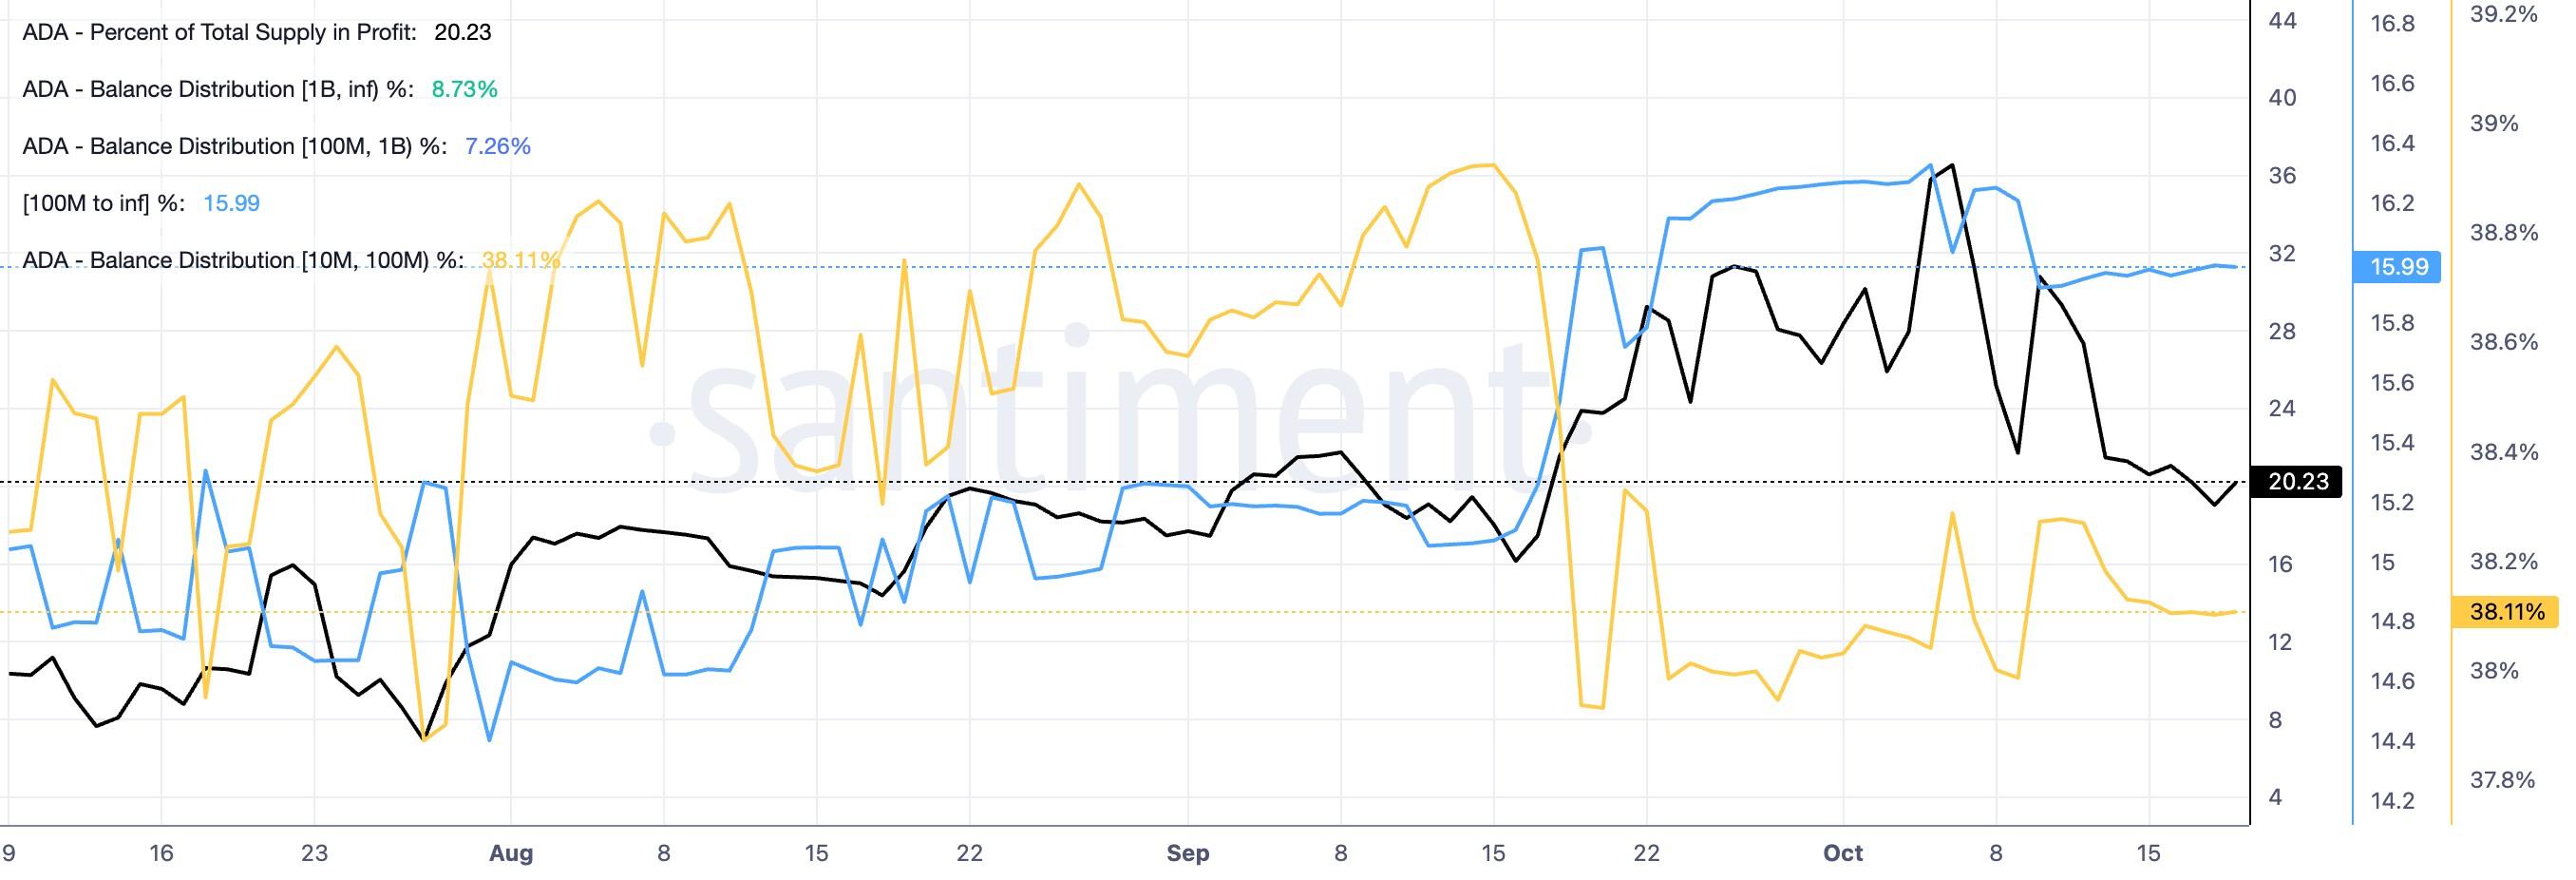
ADA on-chain data. Source: Santiment

Taken together, muted whale activity and declining retail demand reaffirm the short-term correction bias.

Technical outlook: Will Cardano price extend its decline below $0.20?

Cardano holds steady above $0.2200 on Monday, after a bearish breakout of a declining trendline around $0.2321 last week. The ADA price holds beneath both the 50-day and 200-day Exponential Moving Averages (EMAs) at roughly $0.2290 and $0.2395, respectively, reinforcing the bearish bias.

Momentum indicators add a negative bias as the Moving Average Convergence Divergence (MACD) is below zero with a negative histogram, and the Relative Strength Index (RSI) is hovering near 42, suggesting sellers retain the upper hand without yet reaching oversold conditions.

The path of least resistance warns of a steeper decline toward the next support level in sight, aligning with the August 30 low around $0.1894, implying a downside risk of nearly 15%.

Chart Analysis ADA/USDT (Binance)
ADA/USDT daily price chart.

On the topside, initial resistance is seen at the 50-day EMA near $0.2290, with the prior uptrend support-turned-barrier around $0.2321 forming the next cap, ahead of stronger supply at the 200-day EMA close to $0.2395.

(The technical analysis of this story was written with the help of an AI tool. Know more.)

Disclaimer: For information purposes only. Past performance is not indicative of future results.
placeholder
Smart Money is Leaving Nvidia for This AI Chip StockNvidia stock price keeps sliding, yet the usual dip buyers are missing. Institutional money flow on the stock is the most negative of any major chip name, which means big investors are stepping back i
Author  Beincrypto
Jun 30, Tue
Nvidia stock price keeps sliding, yet the usual dip buyers are missing. Institutional money flow on the stock is the most negative of any major chip name, which means big investors are stepping back i
placeholder
NVIDIA Price Forecast: Michael Burry Shorts NVDA, but Analysts See $299On July 1, NVIDIA (NASDAQ: NVDA) sits at $198.34, failing to break above the former support level that is now serving as resistance between $198 and $205 on the 2H chart's downward blue c
Author  TradingKey
Jul 02, Thu
On July 1, NVIDIA (NASDAQ: NVDA) sits at $198.34, failing to break above the former support level that is now serving as resistance between $198 and $205 on the 2H chart's downward blue c
placeholder
XAUUSD Gold Analysis: Gold Holds Above $4,350 Ahead of US Inflation Data Is $4,500 Next? Gold holds above $4,350 following weak US jobs data. As inflation reports approach and UBS eyes $5,000, can XAUUSD break resistance at $4,435 to rally toward $4,500?
Author  Naoufal Seddik
Aug 12, Wed
Gold holds above $4,350 following weak US jobs data. As inflation reports approach and UBS eyes $5,000, can XAUUSD break resistance at $4,435 to rally toward $4,500?
placeholder
Gold Price Analysis Today: Gold Drops 1.32% Despite Lower Fed Rate-Hike Bets, Can $4,313 Support Hold? Gold fell 1.32% on August 13 after rising to $4,449.73, then reversing lower and closing near $4,349.918 below the $4,356.46 support. Softer US inflation data reduced Fed rate hike expectations, but selling pressure still dominated the session. Will $4,313 support hold?
Author  Naoufal Seddik
Aug 14, Fri
Gold fell 1.32% on August 13 after rising to $4,449.73, then reversing lower and closing near $4,349.918 below the $4,356.46 support. Softer US inflation data reduced Fed rate hike expectations, but selling pressure still dominated the session. Will $4,313 support hold?
placeholder
Gold Price Analysis Today: Gold Gains 0.94% as Markets Expect Fed to Hold Rates, Can $4,449 Resistance Break? Gold gained 0.94% on August 17, closing near $4,417.30 as softer US data strengthened expectations for unchanged Fed rates in September. Gold remains bullish, with $4,449.730 resistance and $4,310.650 support in focus.
Author  Naoufal Seddik
Aug 18, Tue
Gold gained 0.94% on August 17, closing near $4,417.30 as softer US data strengthened expectations for unchanged Fed rates in September. Gold remains bullish, with $4,449.730 resistance and $4,310.650 support in focus.
Related Instrument
goTop
quote