


Bitcoin rebounds to $82,000 as PPI hits 6.3%, nearly $1B liquidated
- Bitcoin recovers near $82,000 after briefly dropping below $80,000 despite hotter-than-expected PPI inflation.
- Headline PPI inflation surged 6.3% YoY in September, exceeding forecasts and intensifying concerns about the Federal Reserve's interest rate outlook.
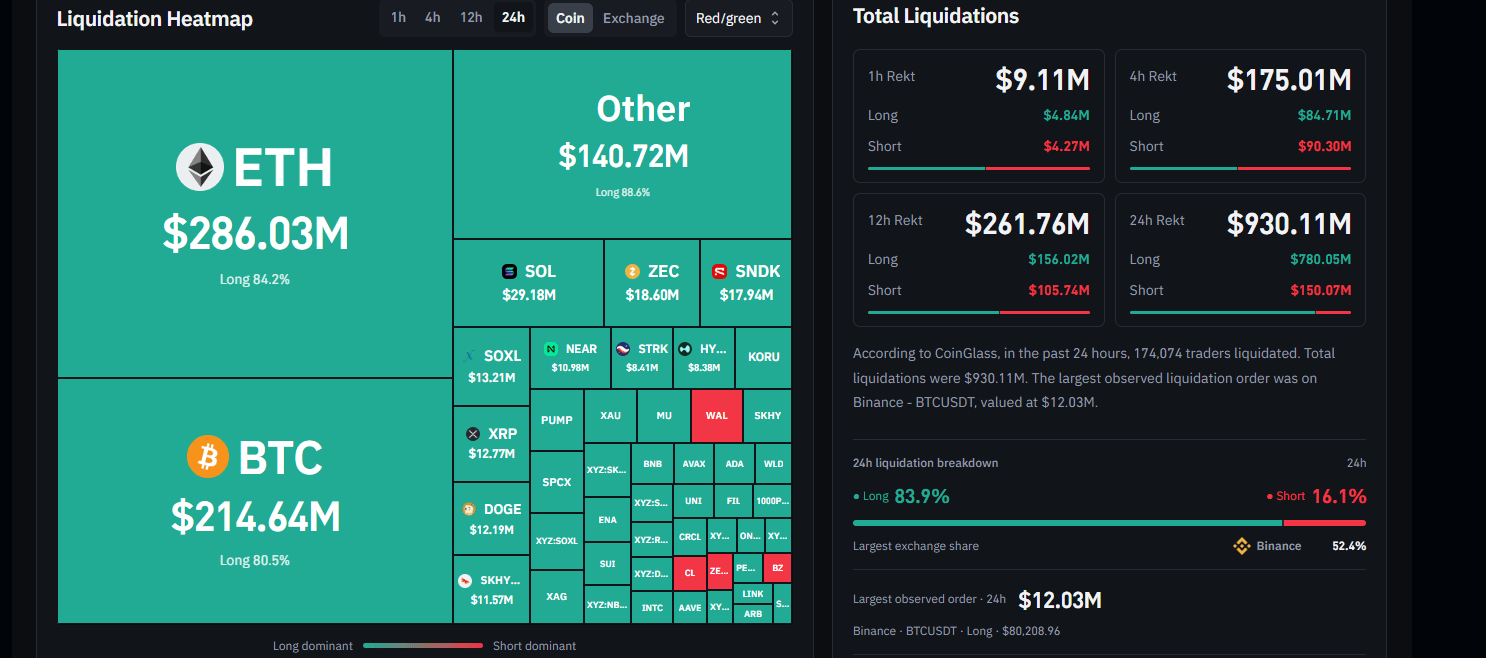
- Crypto liquidations reached $930 million, with $780 million in long positions wiped out as Bitcoin faced inflation-driven volatility.
Bitcoin (BTC) recovered near $82,000 on Thursday after briefly falling below $80,000, paring losses triggered by hotter-than-expected US inflation data.
September PPI inflation rose 6.3% YoY, exceeding forecasts of 5.3% and marking its second-highest level since November 2022. Core PPI inflation climbed to 5% annually, above expectations of 4.4%.
The figures followed Wednesday's hotter-than-expected Consumer Price Index (CPI) report, which showed headline inflation rising above estimates at 3.7% in September and core inflation at 2.6%.
BTC brushes off hot PPI inflation pressure
The top crypto briefly fell to $79,800 after September's Producer Price Index (PPI) data was released, then rebounded to near $82,000.
The recovery comes as Bitcoin faces broader macroeconomic pressure, with persistent inflation raising concerns about the Federal Reserve's (Fed) interest rate outlook.
Following the release, roughly $930 million in derivative positions were liquidated over the past 24 hours, according to Coinglass data.
Long positions accounted for $780 million of the total, suggesting bullish traders bore most of the losses as prices fell. Short traders were not spared, shedding $150 million in liquidations over the same period. Bitcoin liquidations reached $214 million, with long positions accounting for 80% of the total.
The market-wide decline also briefly spilled over into major altcoins. Ethereum (ETH) suffered the most, recording $286 million in liquidations. The top altcoin initially fell to $2,324, while BNB, XRP and Solana (SOL) declined to $712, $1.29 and $101, respectively, before rebounding.
Bitcoin holds critical $80,000 support amid macro pressure
The rebound comes as Bitcoin continues to attract buyers around the $80,000 level, which has emerged as an important support zone.
In an earlier report, analysts identified the $80,000 to $81,500 range as a critical area for Bitcoin, citing buy orders on Binance's spot order book. The level also forms the cost basis of US spot BTC exchange-traded funds (ETFs).
The ETF cost basis, estimated at approximately $81,500, represents the average acquisition price of Bitcoin held by these funds. The $80,000 level sits just below this threshold, creating an area where technical and on-chain support overlap.
However, a sustained break below the zone could expose Bitcoin to further selling pressure, as a large liquidation cluster sits just below it. Below $80,000, BTC could find support at the True Market Mean near $78,000.
BTC is trading at $82,300, up 0.6% in the past 24 hours at the time of writing.
Recommended Articles


