


Top Altcoins Price Forecast: Ripple, Cardano, Solana – Sellers in control flag further downside risk
- Ripple hovers around $1.40 on Thursday, testing the 200-day EMA support after a 5% decline the previous day.
- Cardano edges lower following a 4% decline the previous day, mounting bearish pressure on the 200-day EMA around $0.2423.
- Solana extends losses after a 3% decline the previous day, raising the risk of further downside.
Top altcoins, including Ripple (XRP), Cardano (ADA), and Solana (SOL), are facing near-term selling pressure, extending losses so far this week. Ripple and Solana witness reduced institutional support, while Cardano follows suit. The technical outlook for XRP, ADA, and SOL is bearish, with mounting downside pressure.
ETF confidence decline in altcoins
Solana is losing institutional confidence in the short term, with investor redemptions driving persistent daily outflows. SoSoValue data shows that SOL-focused Exchange Traded Funds (ETFs) recorded $4.80 million in outflows on Wednesday, bringing this week's total to $17.73 million so far.
On the other hand, XRP-focused ETFs recorded zero outflow on Wednesday, after a $3.14 million inflow the previous day. These inflows have declined significantly since a $75.59 million inflow recorded in the last week of September, suggesting reduced institutional demand.

Ripple stands on thin ice
Ripple trades around $1.4100 at press time on Wednesday, holding steady after a 5% decline the previous day. The cross-border remittance token tests both the 50- and 200-day Exponential Moving Averages (EMAs) at $1.4000 and $1.4018, respectively.
A confirmed breakout below this zone could further extend XRP's decline toward the September 16 low at $1.2468, projecting a downside of around 10%. Any deeper pullbacks could attract dip-buying interest around the July 21 high at $1.1646.
Momentum eases on the daily chart, with Moving Average Convergence Divergence (MACD) crossing below the signal line, while the Relative Strength Index (RSI) at 44 drifts below the midline, hinting that bearish momentum is rising.
Looking up, a potential rebound in XRP from the 200-day EMA could extend its recovery toward the August 22 high at $1.6999.
Cardano capped at key resistance warns of a bearish turnaround
Cardano trades around $0.2521, reflecting a mixed tone in the near term. The price continues to decline for the third consecutive day, capped by an overhead trendline near $0.2745 on Tuesday.
The 50-day EMA at $0.2282 and the 200-day EMA at $0.2424 remain below the price, projecting that the long-term uptrend remains intact. A confirmed breakout below the 50-day EMA at $0.2282 could target the 50% retracement of the 0.3136 to $0.1385, at $0.2084.
Momentum on the daily chart shows easing bullish pressure as the RSI dips to 56 while the MACD slips marginally below its signal line.
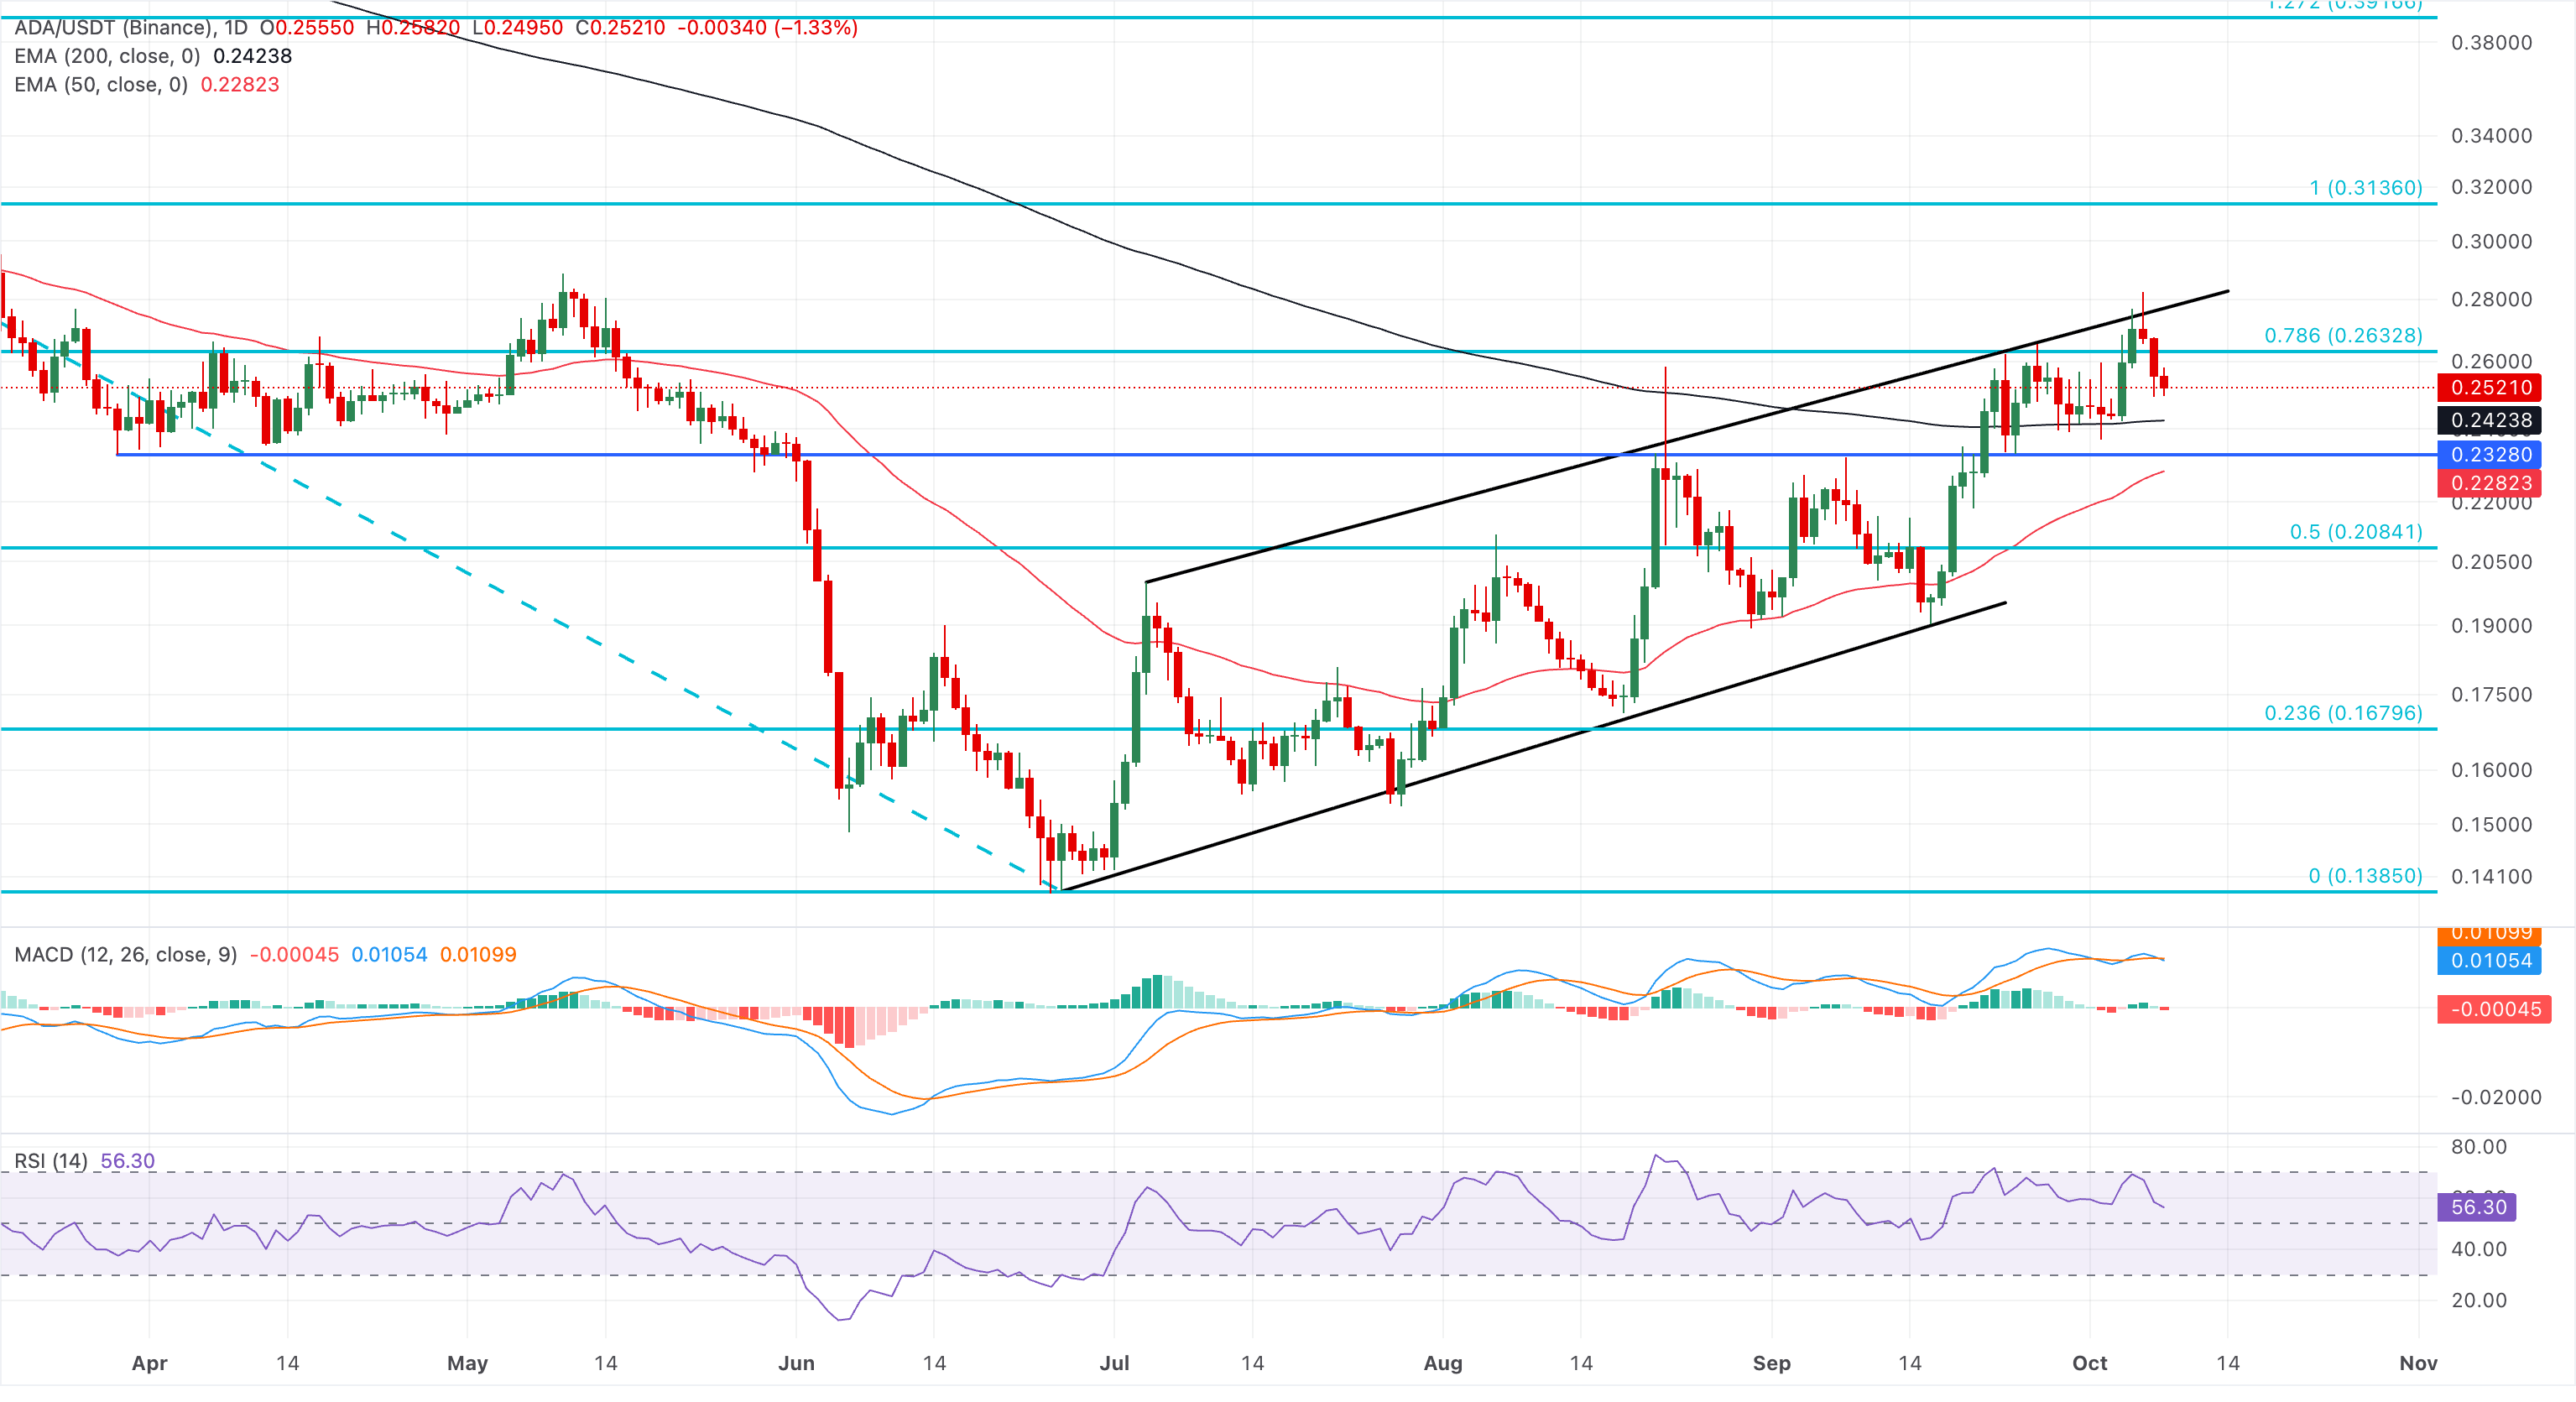
On the topside, initial resistance is at the 78.6% Fibonacci retracement level of $0.2632, ahead of the recent swing high and the 100% retracement level at $0.3136.
Solana risks a drop below $100 as momentum shifts bearish
Solana hovers around $115 at press time on Thursday, projecting a near-term corrective tone amid a long-term recovery. The 50-day EMA at $107.42 and the 200-day EMA at $96.6 reaffirm the ongoing uptrend.
Momentum is starting to shift bearish on the daily chart, with the MACD crossing below its signal line and RSI declining to 51, hinting at waning upside momentum.
Immediate support is provided by the 50-day EMA at $107.42, which reinforces the short-term bullish structure, and then by the 200-day EMA at $96.65 as a deeper, trend-defining floor. As long as SOL stays above the $107.42–$96.65 EMA band, the broader technical tone would continue to favor dip-buying over aggressive selling.
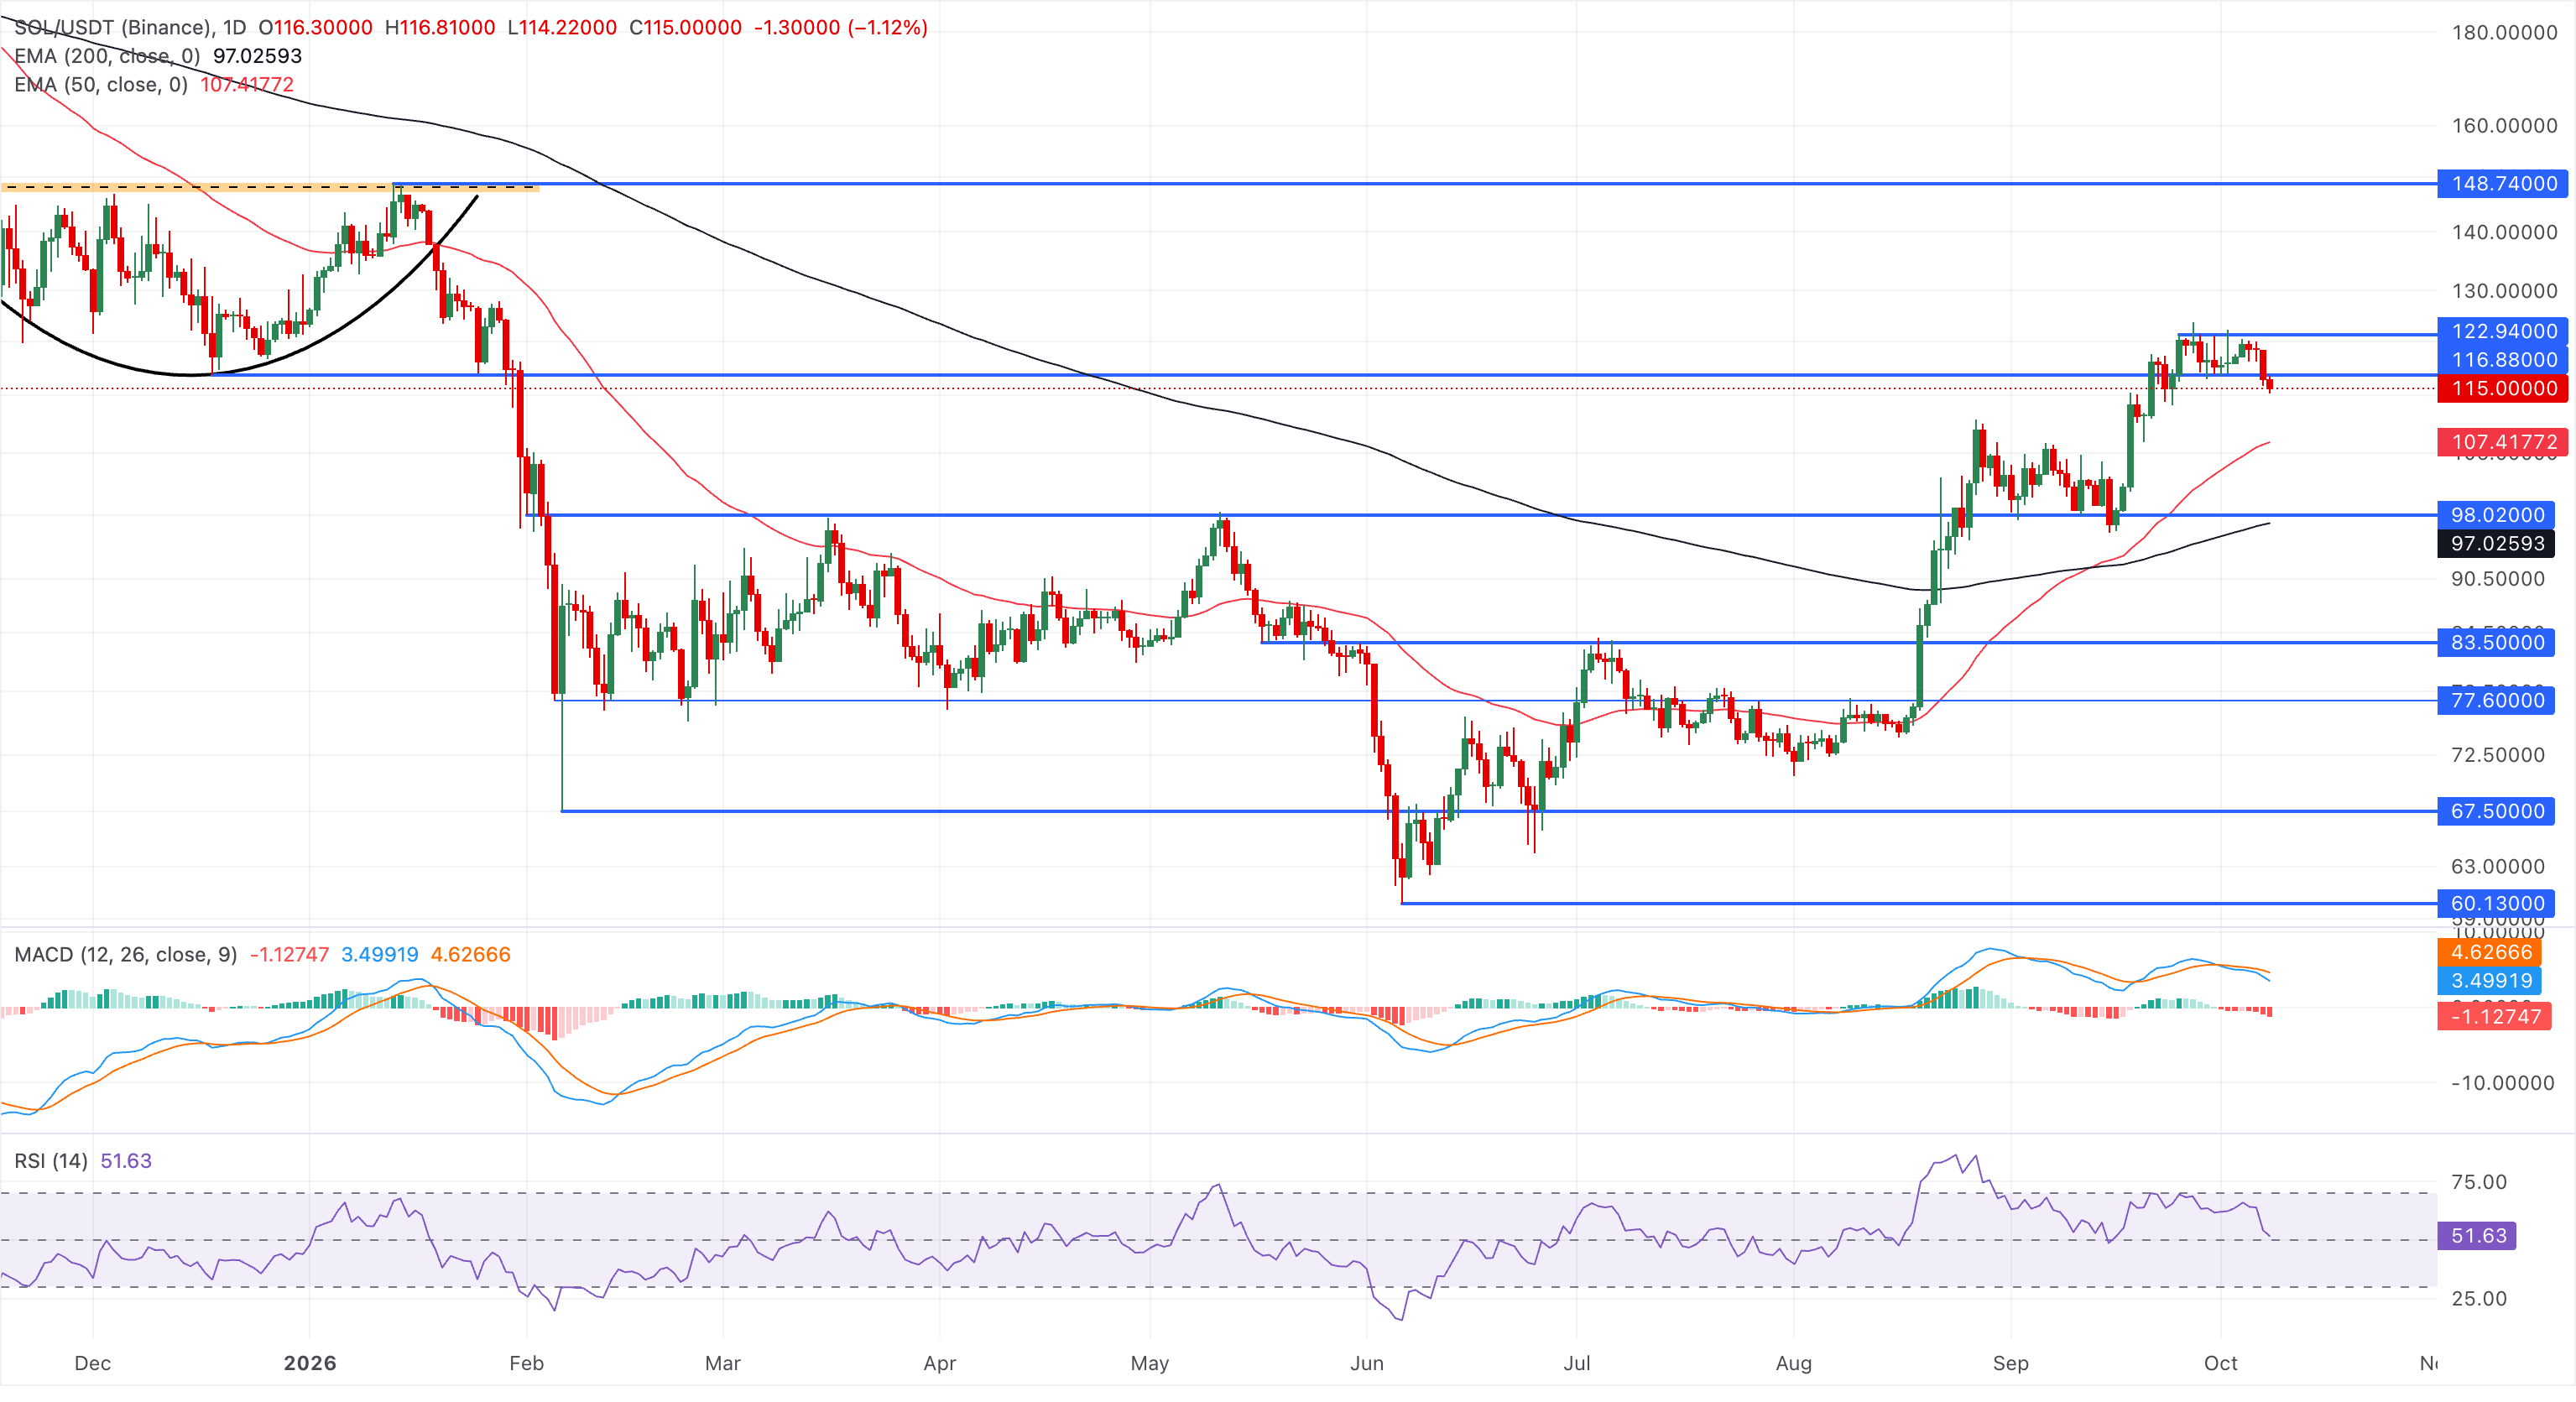
The next notable structural barrier remains the horizontal resistance level at $122.94 set by the September 25 high, followed by the January 13 high at $148.74 as a distant cap that would only come into focus if bulls extend the broader advance.
(The technical analysis of this story was written with the help of an AI tool. Know more.)
Recommended Articles


