


Arbitrum Price Forecast: ARB holds above $0.130 as analyst sees a 70X surge by 2030
- Arbitrum stabilizes above $0.130 support after a sharp sell-off and trades at $0.135 on Tuesday.
- Standard Chartered's Kendrick Geoffrey forecasts a 70X surge in ARB price to $10 following Arbitrum’s launch on Robinhood.
- ARB struggles to regain strength as momentum indicators drop.
Arbitrum (ARB) pares losses, trading at $0.135 on Tuesday as the crypto market awaits the United States (US) Senate vote on the CLARITY Act. The Ethereum (ETH) Layer-2 token consolidates after a rally to $0.207 on September 6, the highest level ARB has traded at since January.
A break above the immediate supply at $0.140 would help to provide a tailwind for a sustained recovery. However, investors should temper expectations if ARB remains below that hurdle, raising the odds of a continued downtrend.
Arbitrum could surge 70X by 2030
Standard Chartered's Kendrick Geoffrey, the global head of digital assets research, predicted in an email sent to Stocktwits on Monday that ARB could rise to $10 by the end of 2030. Such a steady growth would mark an approximately 70X increase from the current market level.
Geoffrey cited Arbitrum’s recent launch on Robinhood Chain, which, in his view, cements the protocol as an emerging leading platform for bringing traditional finance (TradFi) assets on-chain.
"The recent Robinhood Chain launch has demonstrated the potential for Arbitrum to become the number 1 choice for TradFi when bringing assets on-chain," Geoffrey told Stocktwits in the email.
Kendrick projects Arbitrum’s monthly revenue to climb to approximately $5 million in September, driven by strong performance in the Arbitrum Expansion Program. This marks a more than fivefold increase compared to pre-Robinhood Chain launch revenue earlier this July.
The Arbitrum network’s business model isn't limited to processing transactions. It bridges the gap between TradFi and the digital assets market. Financial institutions can launch their own Layer-2 protocols on the Arbitrum blockchain, in turn paying a 10% rolling fee that makes up 10% of the platform’s revenue.
Tokenization is another potential driver of Arbitrum’s revenue, with Standard Chartered projecting the sector to reach $4 trillion by the end of 2028. This growth suggests a significant market expansion for blockchain infrastructure providers.
Still, the bank highlighted slow growth in the asset tokenization sector and increased competition from other blockchain infrastructure providers as potential challenges. Moreover, the ARB token still has no direct avenue to accrue value from Arbitrum’s revenue.
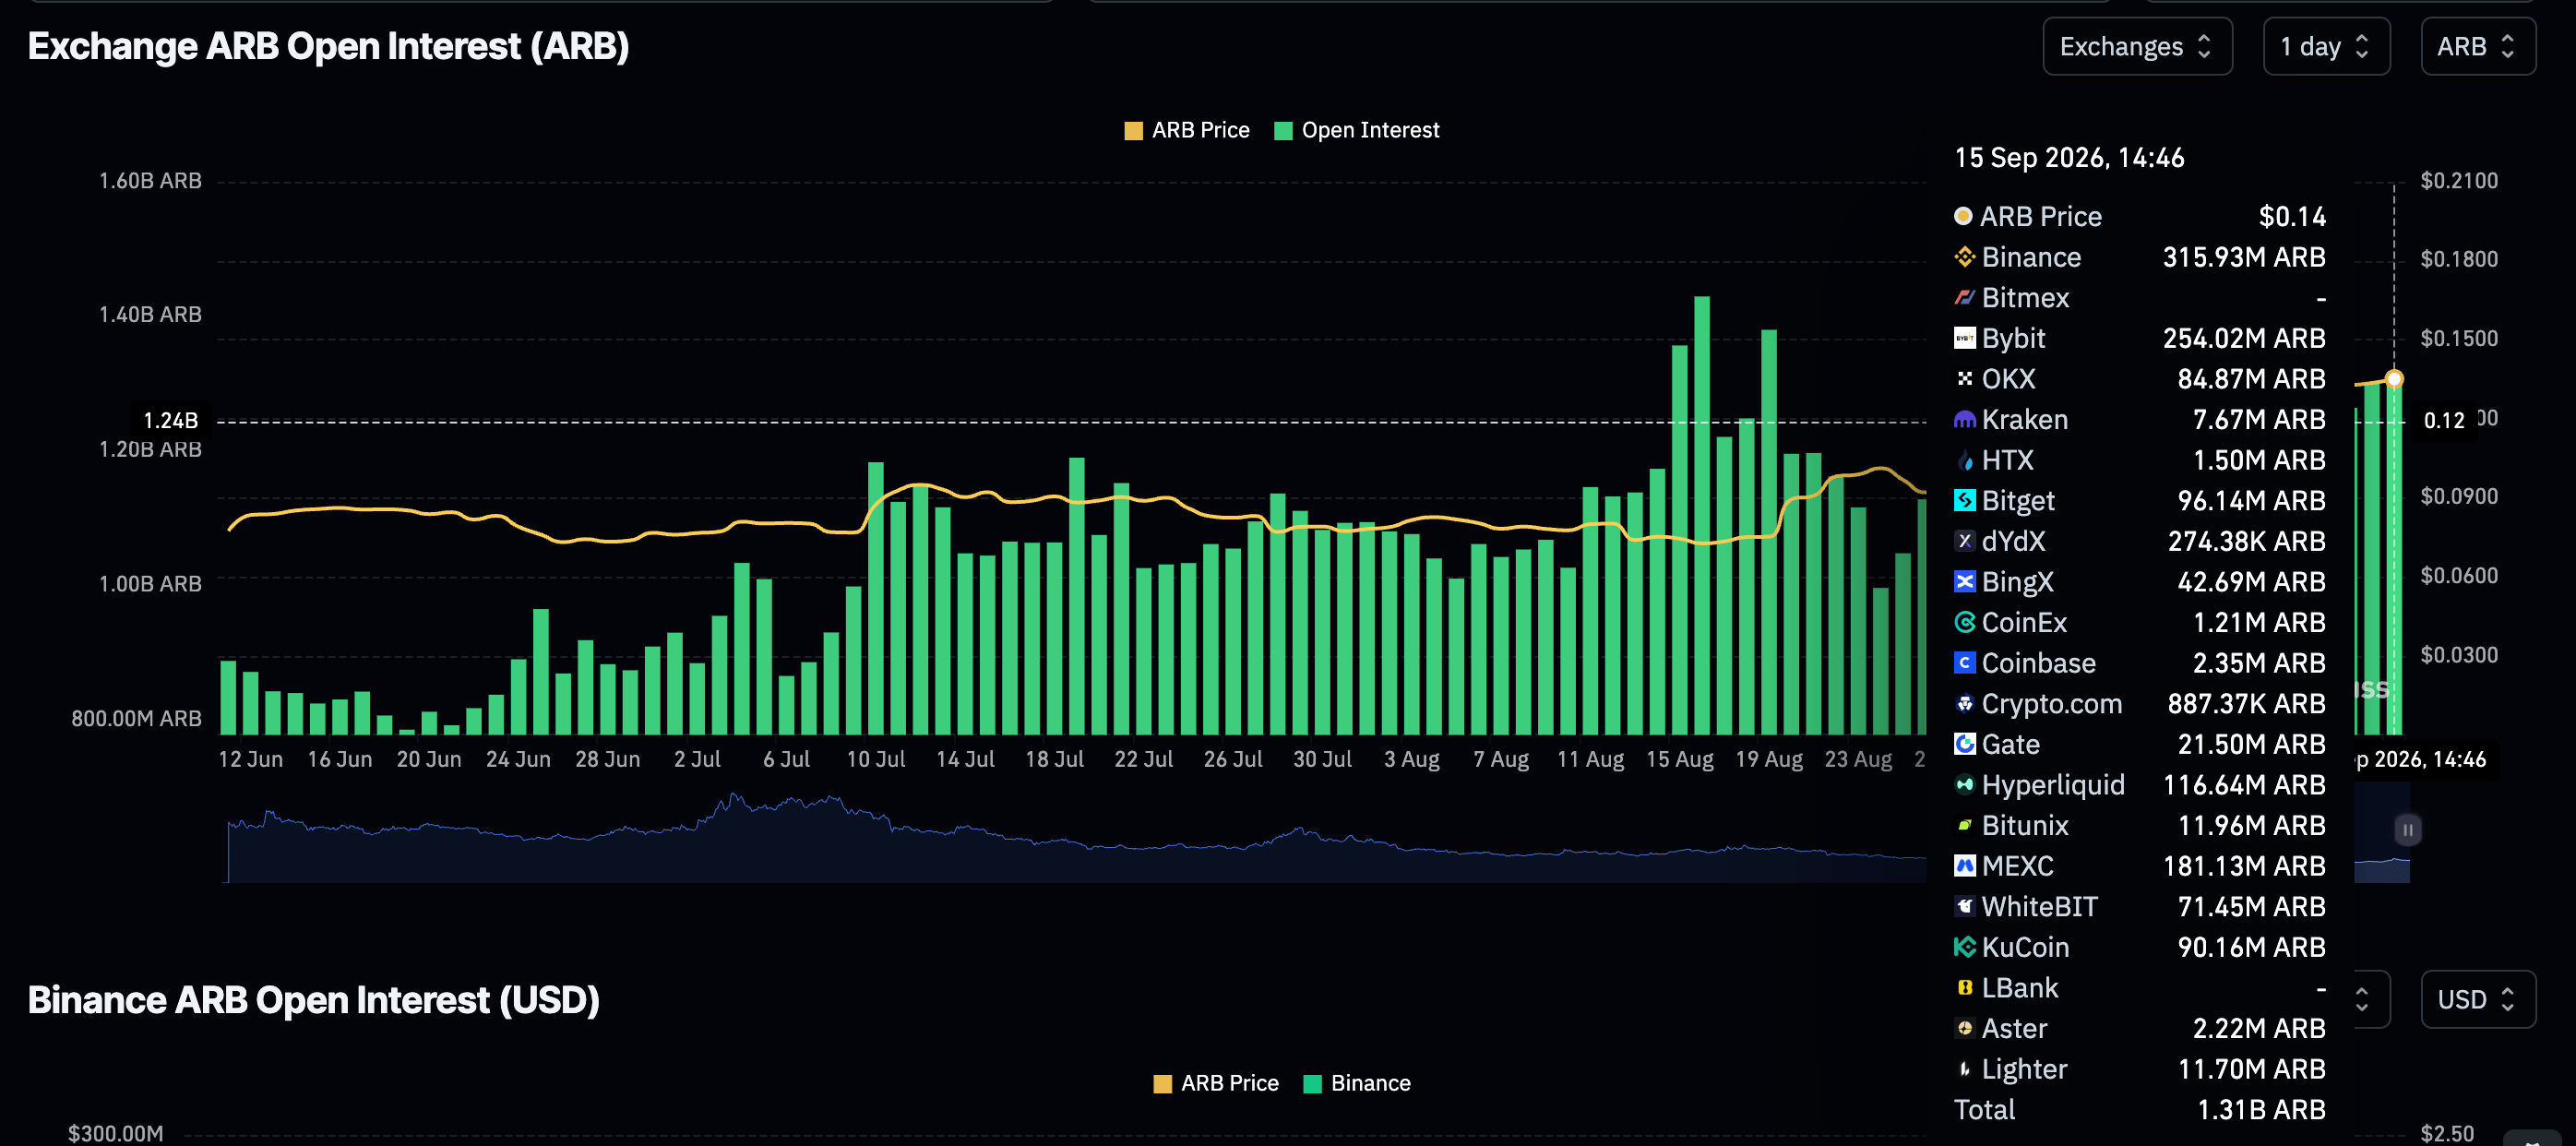
Meanwhile, ARB remains under pressure near support at $0.130, reflecting reduced investor uptake in the derivatives market. CoinGlass data shows perpetual futures Open Interest (OI) at 1.31 billion ARB on Tuesday, up from 1.26 billion ARB the day before. More broadly, OI averaged 1.6 billion ARB on September 8, undermining retail demand and weighing on price action.
Technical analysis: Arbitrum struggles to regain momentum
Arbitrum remains on the back foot despite holding a short-term psychological support level at $0.130 after experiencing a sharp sell-off from September highs of $0.207. Still, the Ethereum Layer-2 token holds a constructive near-term tone as price extends above major moving averages clustered between roughly $0.11 and $0.12. This suggests a defensive bias, while the moving-average cluster acts as a rising demand zone.
However, momentum signals are mixed, with the Moving Average Convergence Divergence (MACD) histogram in negative territory on the daily chart and the Money Flow Index (MFI) hovering just under the neutral 50 line, hinting that buying pressure is moderating after the latest rebound.
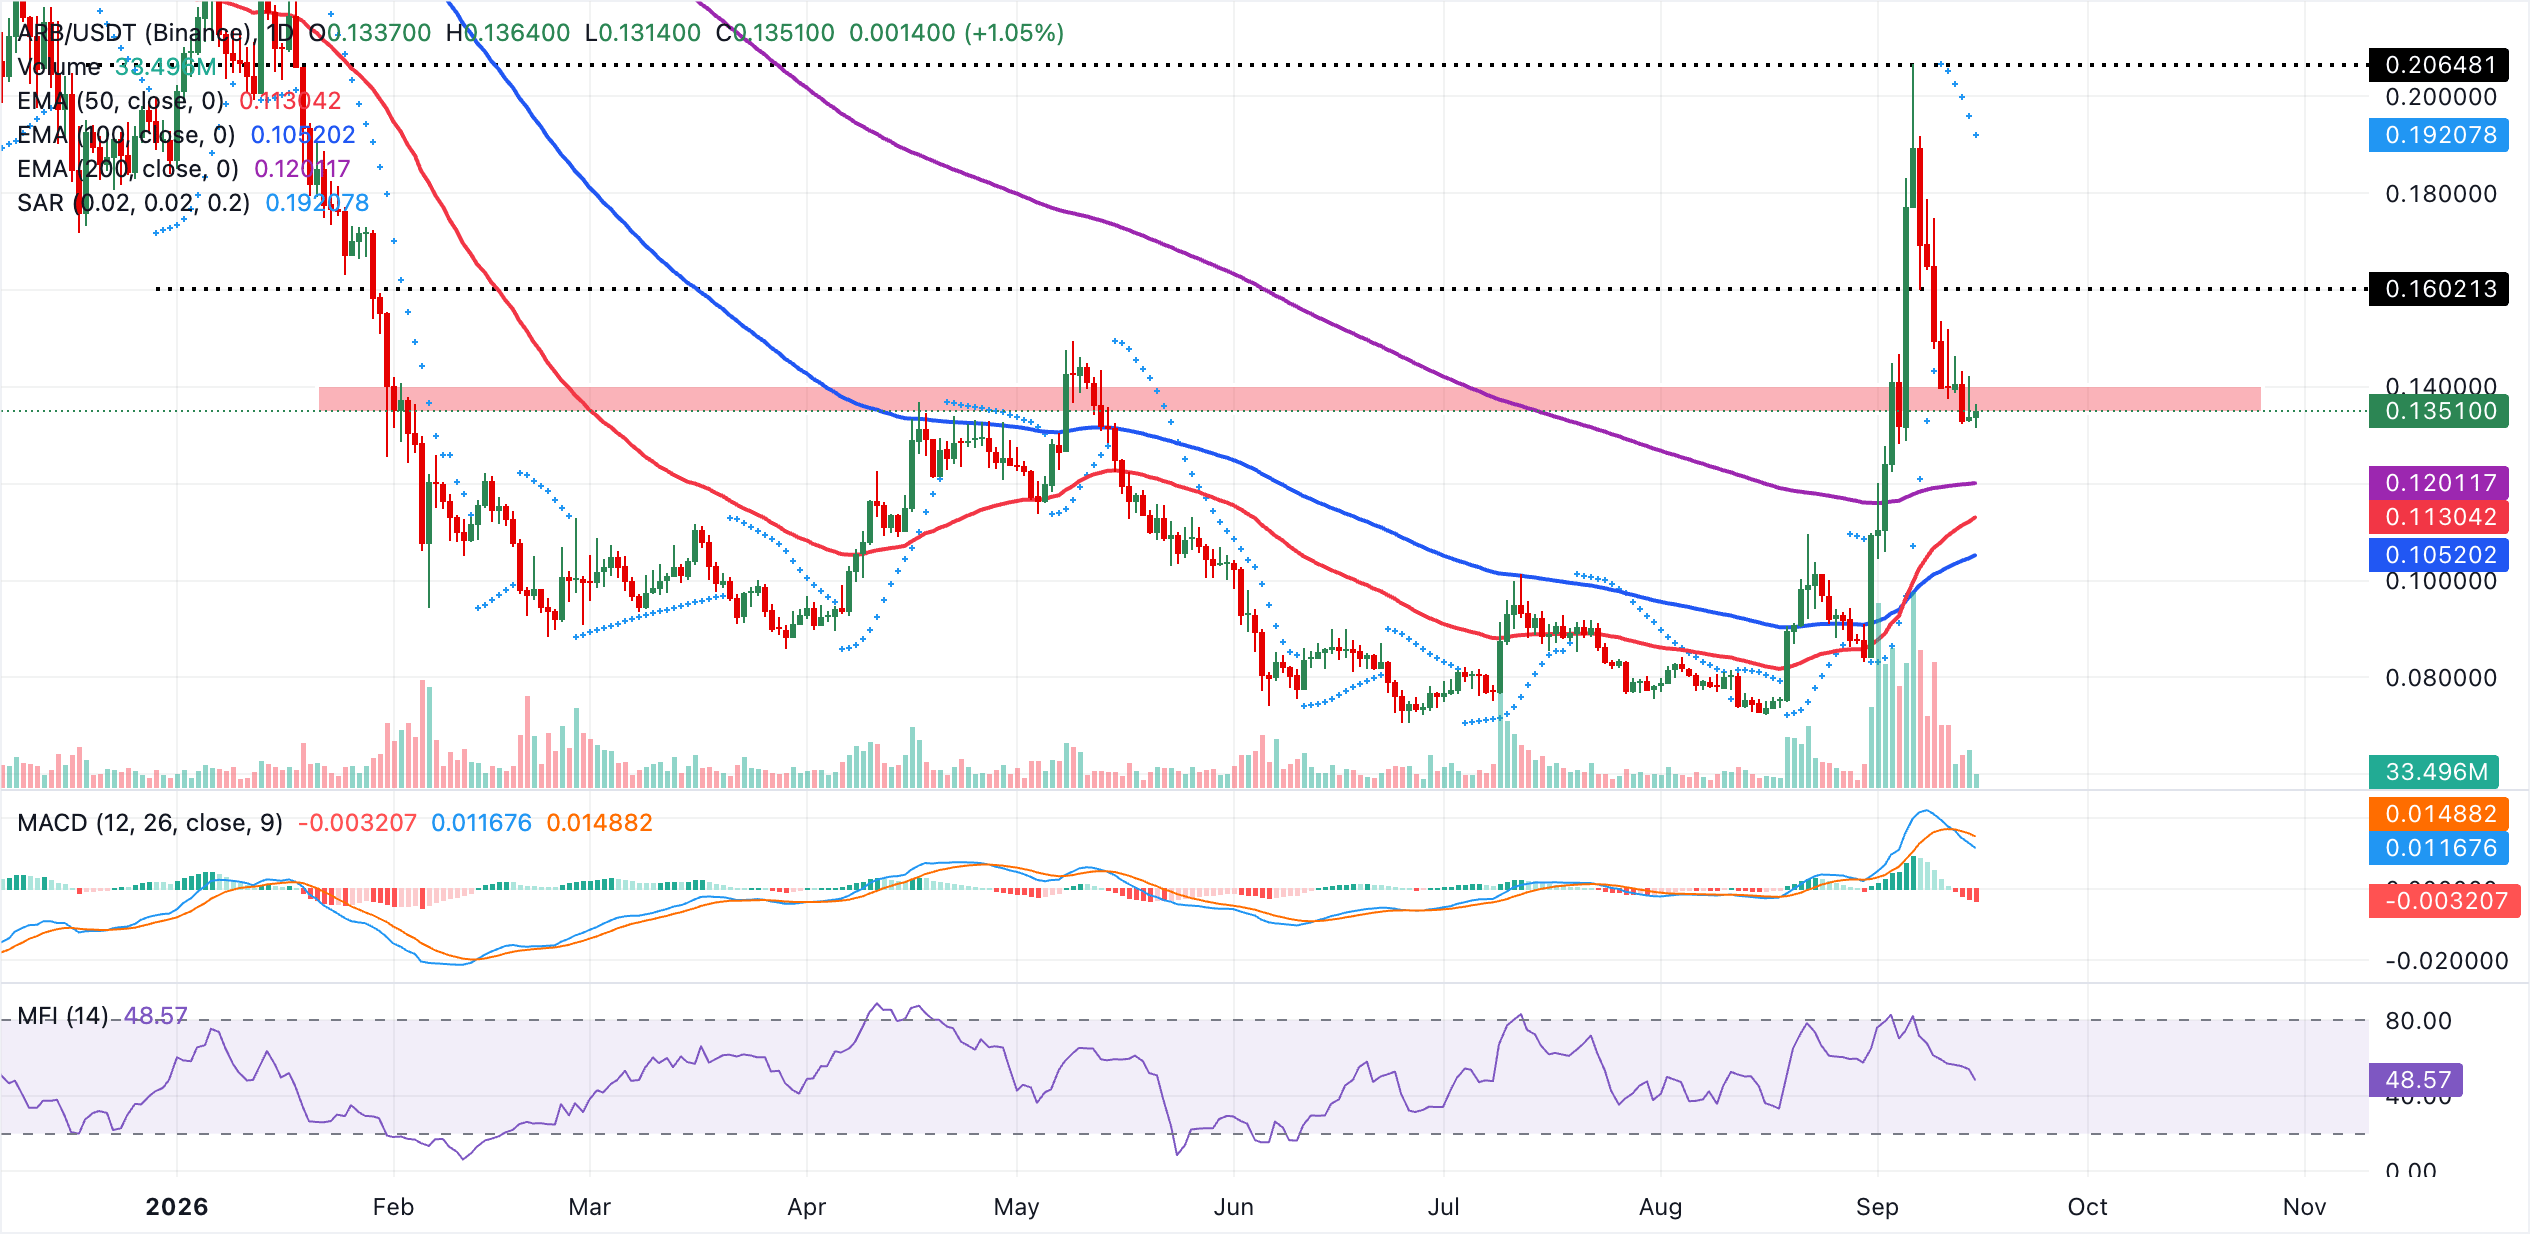
On the topside, immediate resistance lies at $0.140 followed by higher psychological supply at $0.160 and the Parabolic SAR barrier near $0.190, which cap the current advance and would need to be reclaimed to unlock a deeper recovery toward recent swing highs. On the downside, initial support is at $0.130, followed by the 200-day EMA at about $0.120, then the 50-day EMA near $0.113 and the 100-day EMA around $0.105. A daily close back below this EMA band would weaken the bullish case and expose a deeper retracement.
(The technical analysis of this story was written with the help of an AI tool. Know more.)
Bitcoin, altcoins, stablecoins FAQs
Bitcoin is the largest cryptocurrency by market capitalization, a virtual currency designed to serve as money. This form of payment cannot be controlled by any one person, group, or entity, which eliminates the need for third-party participation during financial transactions.
Altcoins are any cryptocurrency apart from Bitcoin, but some also regard Ethereum as a non-altcoin because it is from these two cryptocurrencies that forking happens. If this is true, then Litecoin is the first altcoin, forked from the Bitcoin protocol and, therefore, an “improved” version of it.
Stablecoins are cryptocurrencies designed to have a stable price, with their value backed by a reserve of the asset it represents. To achieve this, the value of any one stablecoin is pegged to a commodity or financial instrument, such as the US Dollar (USD), with its supply regulated by an algorithm or demand. The main goal of stablecoins is to provide an on/off-ramp for investors willing to trade and invest in cryptocurrencies. Stablecoins also allow investors to store value since cryptocurrencies, in general, are subject to volatility.
Bitcoin dominance is the ratio of Bitcoin's market capitalization to the total market capitalization of all cryptocurrencies combined. It provides a clear picture of Bitcoin’s interest among investors. A high BTC dominance typically happens before and during a bull run, in which investors resort to investing in relatively stable and high market capitalization cryptocurrency like Bitcoin. A drop in BTC dominance usually means that investors are moving their capital and/or profits to altcoins in a quest for higher returns, which usually triggers an explosion of altcoin rallies.
Recommended Articles


