

US Treasury Yields Hit Nearly 20-Year High, Dragging Gold Below $4,300: Will Gold Keep Falling?

Source Tradingkey

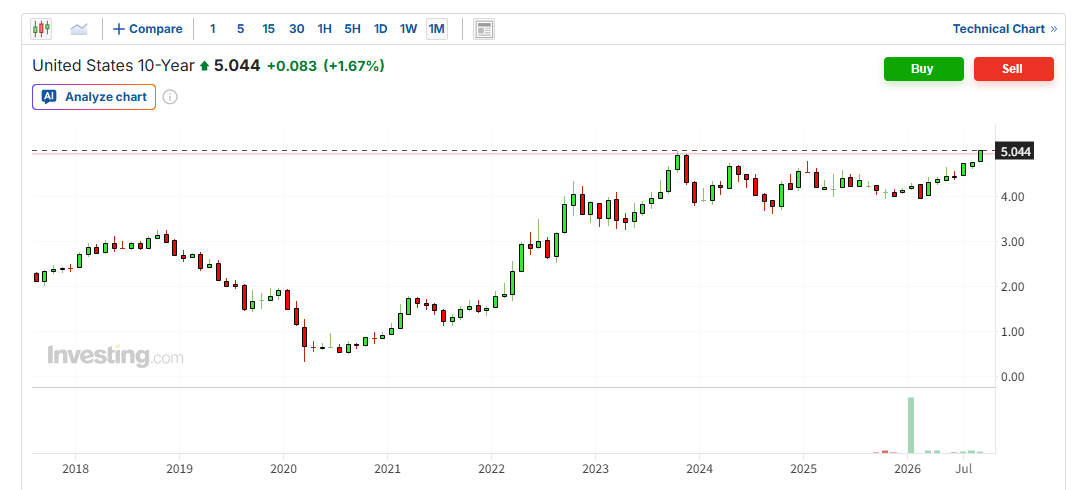
TradingKey - As of the European trading session on September 15, the 30-year U.S. Treasury yield rose to 5.3960% intraday, while the 10-year U.S. Treasury yield once touched 5.047%, both reaching near 20-year highs. As long-term yields continued to climb, spot gold (XAUUSD) fell below the $4,300 mark, retreating at one point to around $4,260.
us-29cf8ac2641746b597d2d8bbafbb1696

10-year U.S. Treasury yield chart, Source: Investing

The main factors driving the rise in U.S. Treasury yields remain inflation and monetary policy expectations. Recently, oil prices have remained elevated, with Middle East supply risks further pushing up energy prices. On Tuesday, WTI crude oil rose by approximately 1.8% to above $103, while Brent crude rose above $108. Higher energy costs have increased the risk of U.S. inflation remaining high, while also reinforcing market expectations that the Federal Reserve will continue to tighten monetary policy.

The market currently widely expects the Federal Reserve to hike interest rates by 25 basis points at the conclusion of its September meeting on Wednesday, raising the target range for the federal funds rate to 3.75%–4.00%, with the probability of a rate hike approaching 90%. Morgan Stanley expects the Fed to raise rates by 25 basis points this time and potentially hike again in December.

A high interest rate environment directly increases the opportunity cost of holding gold. Meanwhile, the continued strengthening of the U.S. dollar index further adds downward pressure on gold prices.
gold-b2494e02245648c78edbd4b136eb22f3

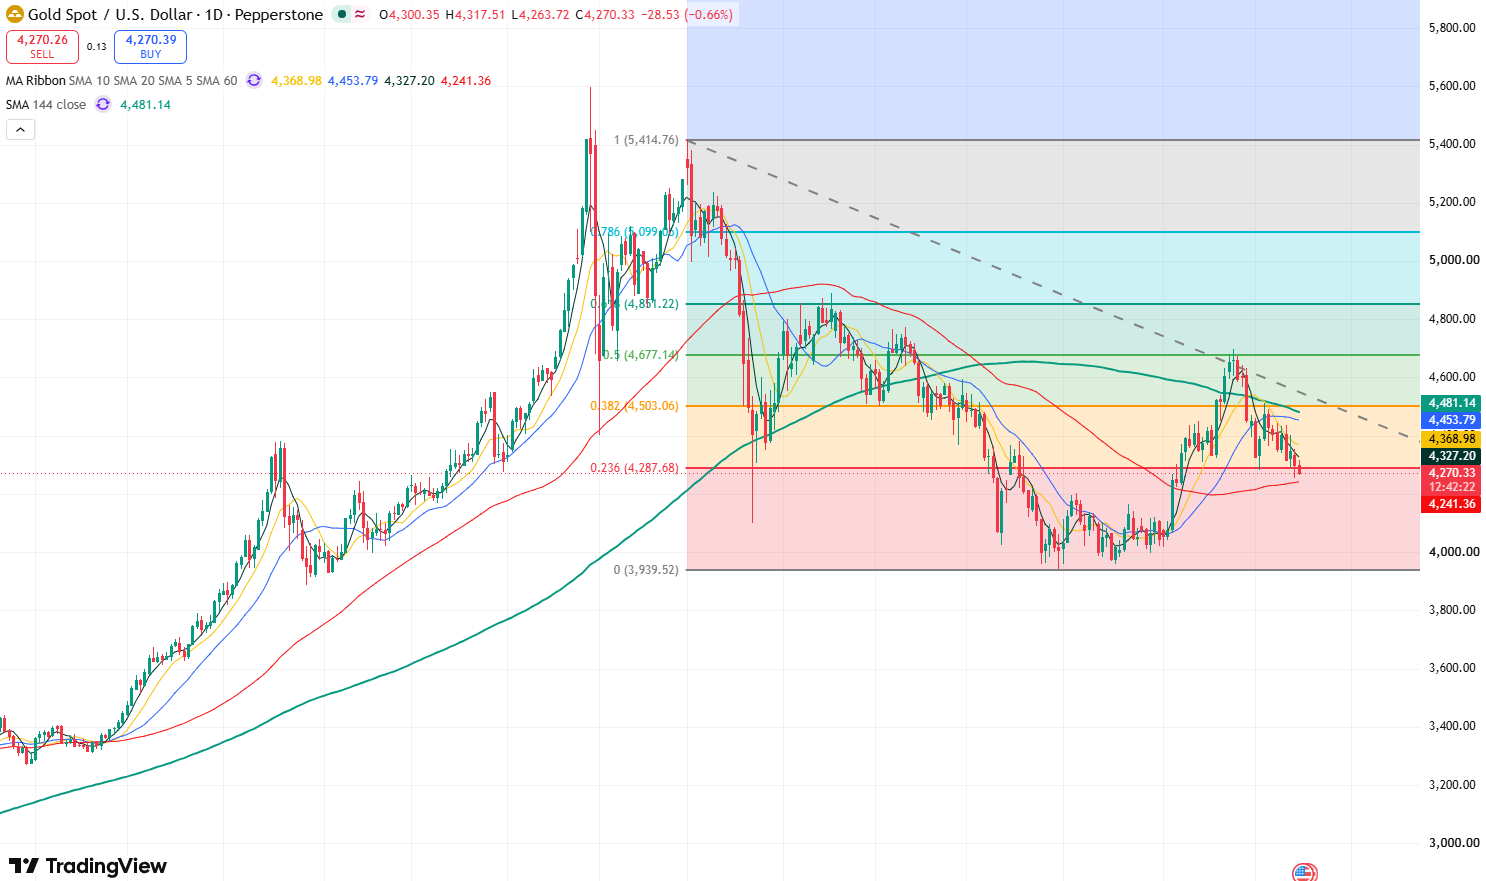
Gold price daily chart, Source: TradingView

Looking at the daily chart of gold, the closing price on Monday confirmed a breakdown below the $4,300 mark, closing at $4,298.86 that day. The decline continued today, dipping to as low as $4,263.72. The primary support level below gold prices is the 60-day moving average, around $4,241. If today's closing price can hold firmly above this level, gold prices may experience a short-term technical recovery rebound, with potential to bounce toward around $4,330.

Conversely, if gold prices fall below the 60-day moving average, they may test the support level at $4,200 on the downside. If the decline persists, gold prices could fall toward the $4,000 mark.

Disclaimer: For information purposes only. Past performance is not indicative of future results.
placeholder
XRP Price Prediction for July 2026: Can Buyers Finally Break the Downtrend?XRP (XRP) price trades near $1.05, caught between a year-long downtrend and a sudden burst of buying.July has historically rewarded XRP holders. This year the month arrives with on-chain accumulation
Author  Beincrypto
Jun 30, Tue
XRP (XRP) price trades near $1.05, caught between a year-long downtrend and a sudden burst of buying.July has historically rewarded XRP holders. This year the month arrives with on-chain accumulation
placeholder
What to Expect From Ethereum (ETH) in July 2026Ethereum (ETH) enters July 2026 trading near $1,570, close to multi-month lows, after recording its first run of three consecutive red quarterly candles in its history.On-chain data and price charts n
Author  Beincrypto
Jul 01, Wed
Ethereum (ETH) enters July 2026 trading near $1,570, close to multi-month lows, after recording its first run of three consecutive red quarterly candles in its history.On-chain data and price charts n
placeholder
Intel Price Forecast: Nvidia Picked Xeon 6, Invested $5B, Yet Analysts Still Trail INTCIntel Corporation (NASDAQ: INTC) sits at $140.05, holding firm on the ascending trendline within the 2H timeframe. The RSI indicator is currently reading 55.21, positioning it as neutral-
Author  TradingKey
Jul 02, Thu
Intel Corporation (NASDAQ: INTC) sits at $140.05, holding firm on the ascending trendline within the 2H timeframe. The RSI indicator is currently reading 55.21, positioning it as neutral-
placeholder
Gold Price Analysis Today: Gold Drops 1.32% Despite Lower Fed Rate-Hike Bets, Can $4,313 Support Hold? Gold fell 1.32% on August 13 after rising to $4,449.73, then reversing lower and closing near $4,349.918 below the $4,356.46 support. Softer US inflation data reduced Fed rate hike expectations, but selling pressure still dominated the session. Will $4,313 support hold?
Author  Naoufal Seddik
Aug 14, Fri
Gold fell 1.32% on August 13 after rising to $4,449.73, then reversing lower and closing near $4,349.918 below the $4,356.46 support. Softer US inflation data reduced Fed rate hike expectations, but selling pressure still dominated the session. Will $4,313 support hold?
placeholder
Gold Price Analysis Today: Gold Gains 0.94% as Markets Expect Fed to Hold Rates, Can $4,449 Resistance Break? Gold gained 0.94% on August 17, closing near $4,417.30 as softer US data strengthened expectations for unchanged Fed rates in September. Gold remains bullish, with $4,449.730 resistance and $4,310.650 support in focus.
Author  Naoufal Seddik
Aug 18, Tue
Gold gained 0.94% on August 17, closing near $4,417.30 as softer US data strengthened expectations for unchanged Fed rates in September. Gold remains bullish, with $4,449.730 resistance and $4,310.650 support in focus.
goTop
quote