

Pi Network Price Forecast: Steady recovery in PI gains mild bullish momentum

Source Fxstreet
  • Pi Network edges above $0.0930 on Wednesday, extending gains for the third consecutive day.
  • Fear and Greed Index reading of 71 suggests a firm risk-on sentiment, improving the odds of capital rotation into altcoins.
  • The technical outlook for PI indicates a mild bullish bias, with momentum indicators signaling elevated upside pressure.

Pi Network (PI) extends a mild recovery above $0.093 on Wednesday, marking its third consecutive day of trading in the green. The broader crypto market's risk-on sentiment holds firm despite renewed US-Iran tensions, suggesting a potential capital rotation into high-risk, low-valuation altcoins. The technical outlook for PI indicates an upside bias, with the momentum indicators printing higher readings.

Crypto investors retain risk appetite

The Fear and Greed Index at 71 on Wednesday shows bullish sentiment in the crypto market easing to healthy levels after being overstretched. As buyers remain in control, the possibility of capital rotating from blue-chip cryptocurrencies to low-valuation altcoins persists. 
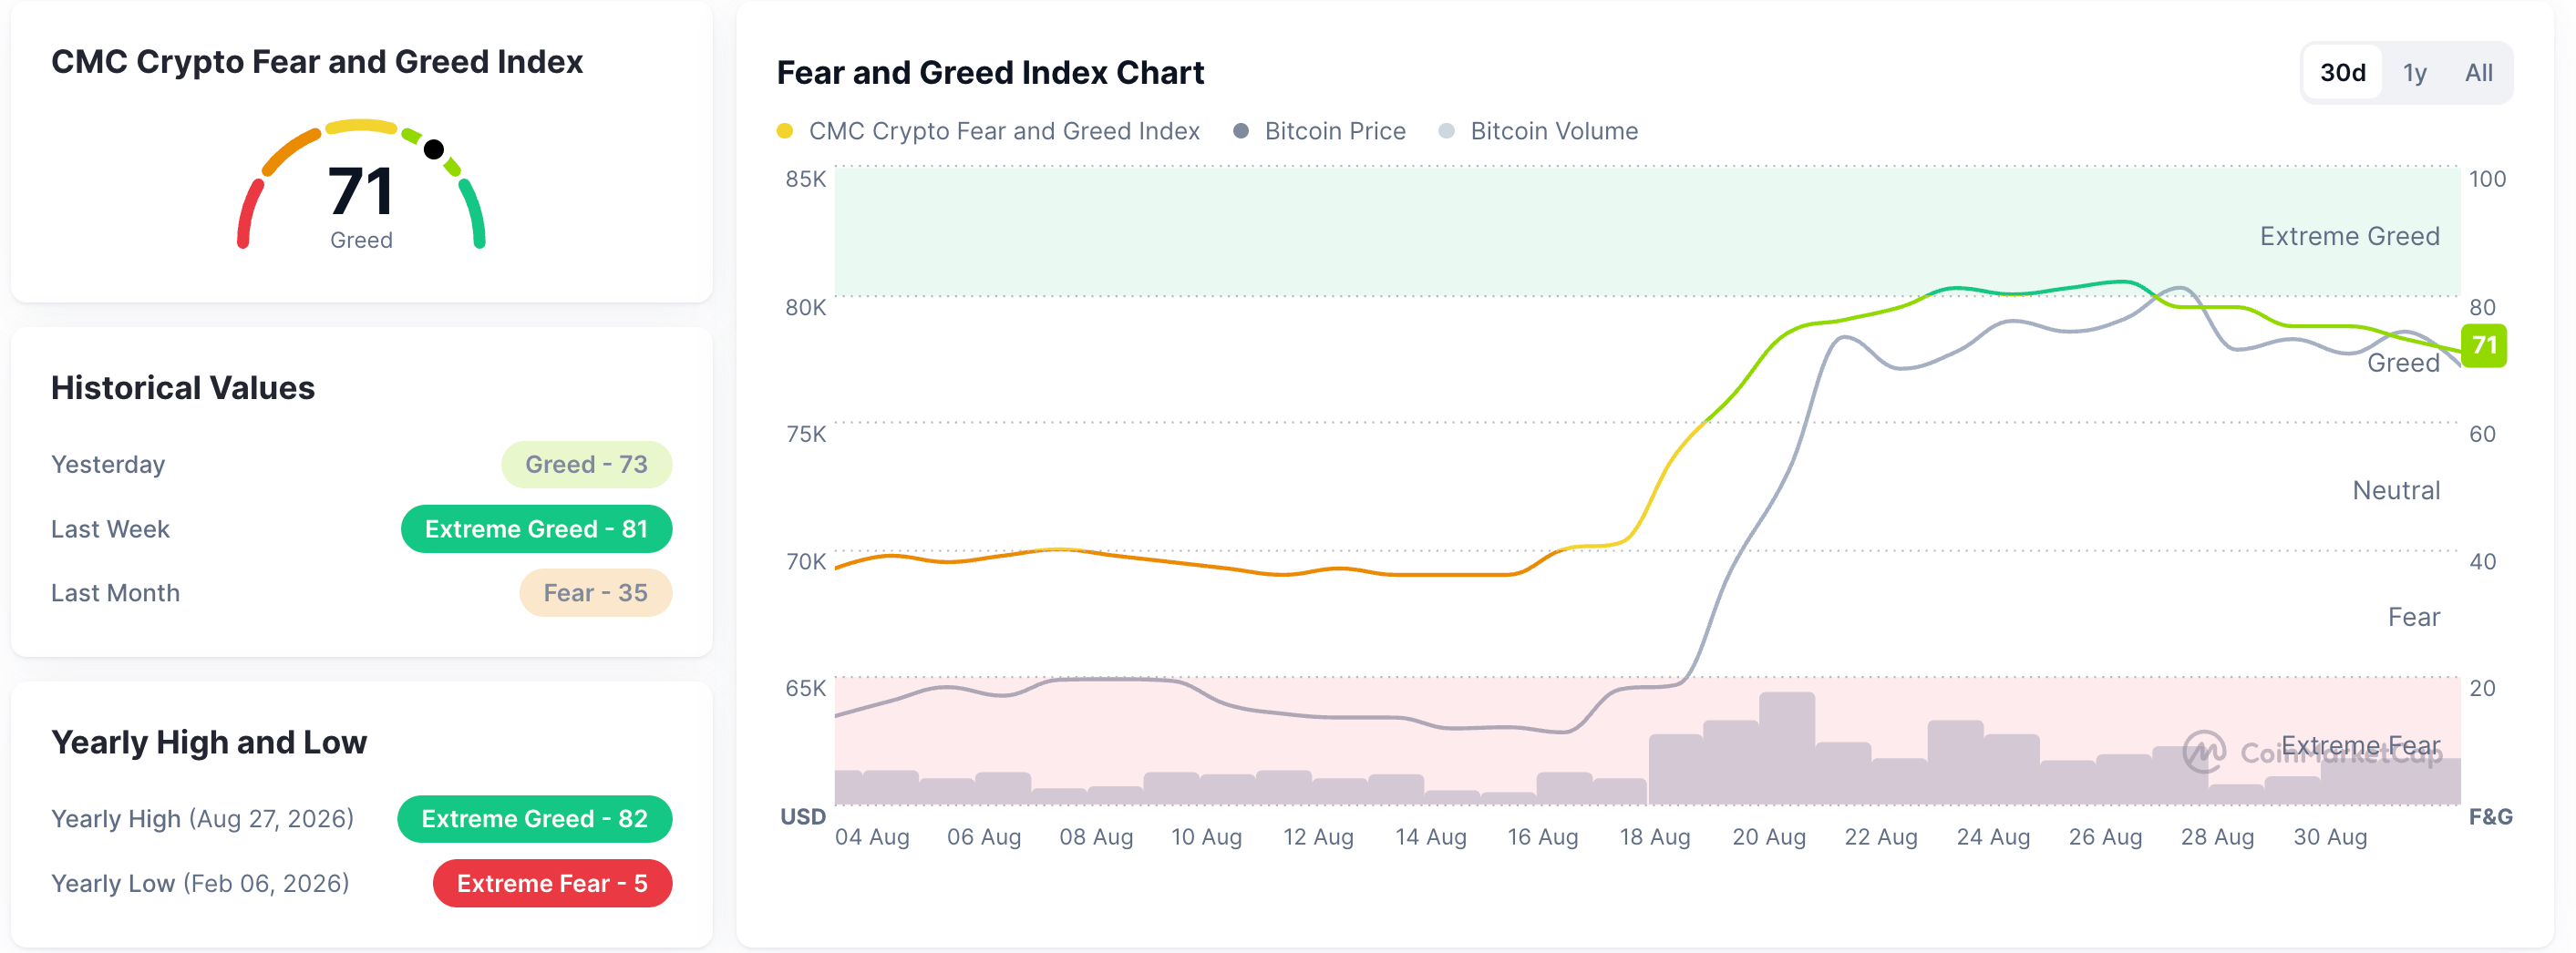
Fear and Greed Index. Source: CoinMarketCap

However, the resumption of the war between the US and Iran raises concerns about broader market sentiment, as Bitcoin (BTC) slipped below $77,000 on Wednesday, and the derivatives market saw $343 million in total liquidations, led by $273 million in long liquidations.

On the other hand, the launch of utility-focused SoloHost apps, OpenClaw and the Atlassian MCP Server, keeps the community sentiment optimistic. The apps enable users to run local AI agents and specialized developer utilities, reflecting a focus on ecosystem expansion and additional utility of Pi Nodes, as previously reported by FXStreet.

https://x.com/PiCoreTeam/status/2094807674818797870

Technical outlook: Will PI token price reclaim $0.10?

Pi Network trades above $0.0930 at press time on Wednesday, holding in a subdued stance as it remains below all key exponential moving averages. The 50-day Exponential Moving Average (EMA) at $0.0937, the 100-day EMA at $0.1079, and the 200-day EMA near $0.1469 all sit overhead, suggesting rallies are still capped within a broader bearish structure.

The Relative Strength Index (RSI) at 55 on the daily chart indicates a steady recovery above the midline, suggesting rising buying pressure.

A confirmed breakout above the 50-day EMA at $0.0937 could extend PI token's recovery toward the 50% retracement at $0.1022, measured from $0.1341 to $0.0703. Beyond this, the 100-day EMA at $0.1079 and the 78.6% Fibonacci retracement level at $0.1204 could serve as overhead barriers.
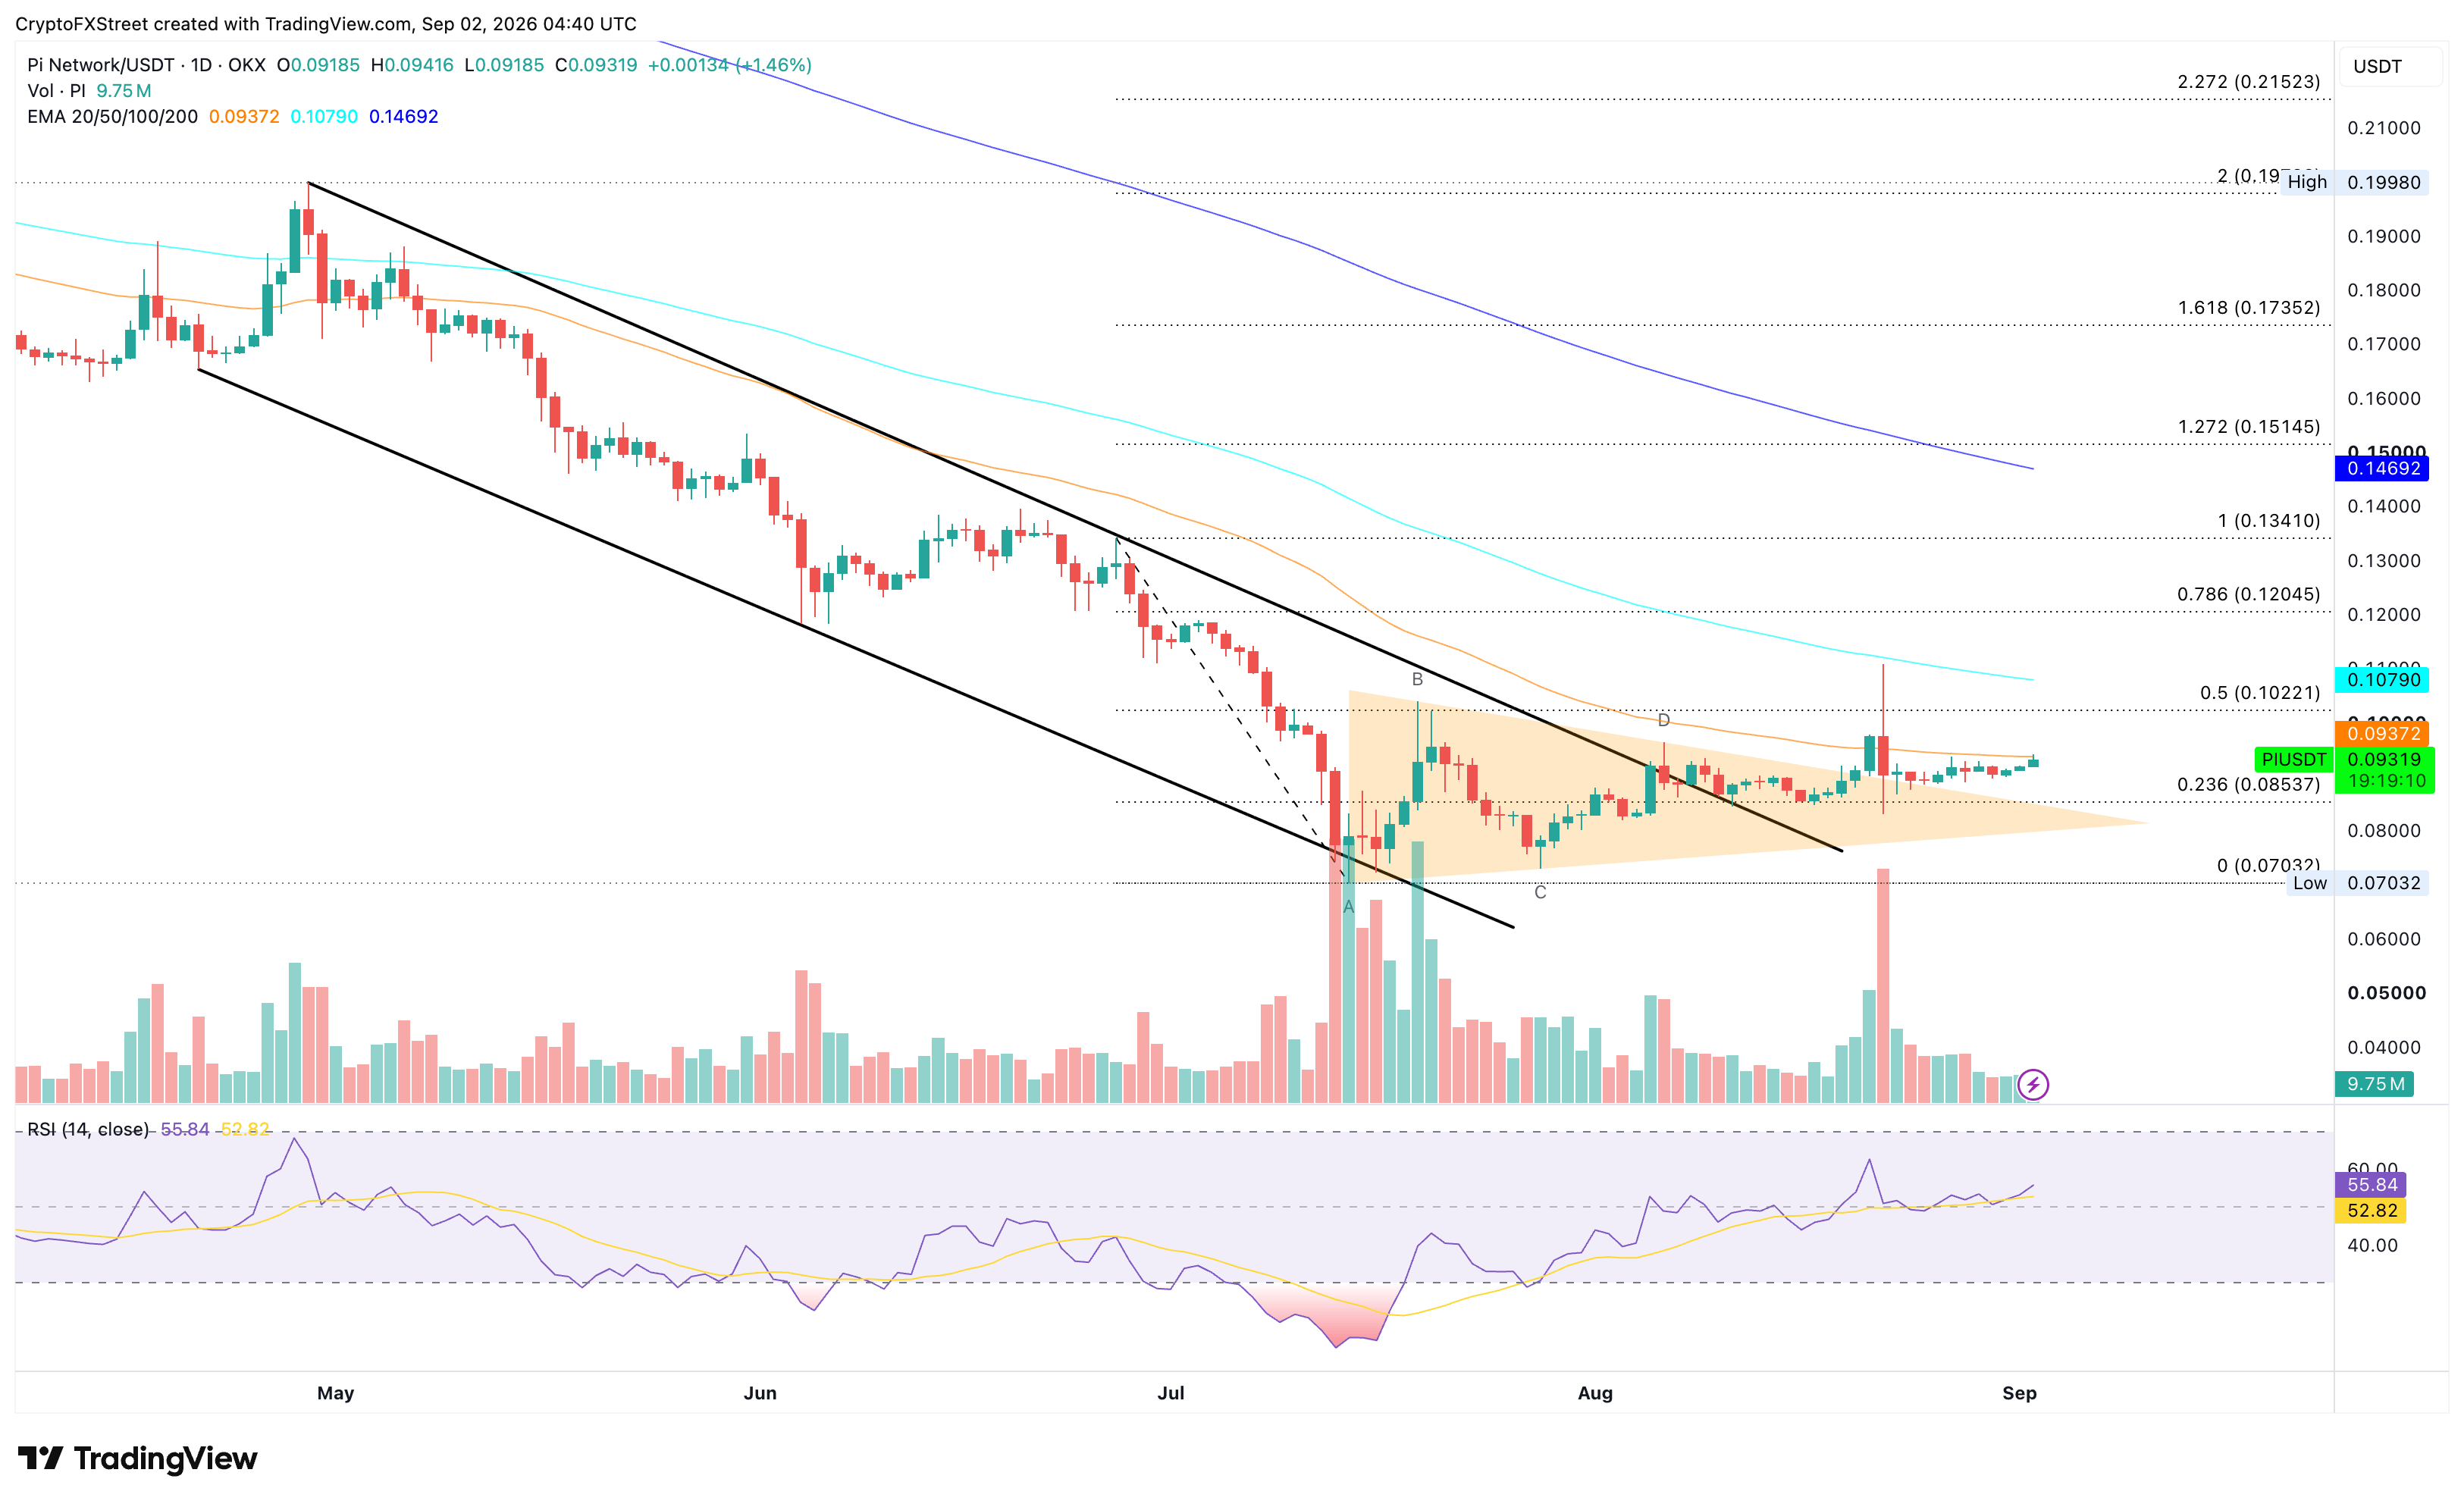
PI/USDT daily price chart.

On the downside, the 23.6% Fibonacci retracement at $0.0853 remains a crucial support band, guarding the swing low at $0.0703.

(The technical analysis of this story was written with the help of an AI tool. Know more.)

Disclaimer: For information purposes only. Past performance is not indicative of future results.
placeholder
Will the Tech Rally Continue? The Technical Verdict on the NASDAQ 100 Riding a massive 32% post-earnings wave, the Nasdaq-100 is showing its first signs of exhaustion. We break down crucial exit and entry rules for long positions this week.
Author  Mitrade Team
Jun 05, Fri
Riding a massive 32% post-earnings wave, the Nasdaq-100 is showing its first signs of exhaustion. We break down crucial exit and entry rules for long positions this week.
placeholder
XRP Price Prediction for July 2026: Can Buyers Finally Break the Downtrend?XRP (XRP) price trades near $1.05, caught between a year-long downtrend and a sudden burst of buying.July has historically rewarded XRP holders. This year the month arrives with on-chain accumulation
Author  Beincrypto
Jun 30, Tue
XRP (XRP) price trades near $1.05, caught between a year-long downtrend and a sudden burst of buying.July has historically rewarded XRP holders. This year the month arrives with on-chain accumulation
placeholder
Today’s Market Recap: Chip Stocks Retreat Collectively, Meta Rises Against the Trend, Non-Farm Payrolls Become the Next Key CatalystOn July 1, Eastern Time, U.S. stocks closed fluctuating lower on the first trading day of the second half of the year. Although some megacap tech stocks such as Meta (
Author  TradingKey
Jul 02, Thu
On July 1, Eastern Time, U.S. stocks closed fluctuating lower on the first trading day of the second half of the year. Although some megacap tech stocks such as Meta (
placeholder
Gold Price Analysis Today: Gold Gains 0.94% as Markets Expect Fed to Hold Rates, Can $4,449 Resistance Break? Gold gained 0.94% on August 17, closing near $4,417.30 as softer US data strengthened expectations for unchanged Fed rates in September. Gold remains bullish, with $4,449.730 resistance and $4,310.650 support in focus.
Author  Naoufal Seddik
Aug 18, Tue
Gold gained 0.94% on August 17, closing near $4,417.30 as softer US data strengthened expectations for unchanged Fed rates in September. Gold remains bullish, with $4,449.730 resistance and $4,310.650 support in focus.
placeholder
Gold Price Analysis Today: Gold Rebounds After 1.91% Drop as Yields Ease. Is $4,449 Next? Gold fell about 1.91% on August 18 before producing a strong bullish reaction from the 1-hour demand zone in early August 19 trading. RSI is recovering from oversold conditions, but Supertrend remains bearish as traders await the Fed minutes.
Author  Naoufal Seddik
Aug 19, Wed
Gold fell about 1.91% on August 18 before producing a strong bullish reaction from the 1-hour demand zone in early August 19 trading. RSI is recovering from oversold conditions, but Supertrend remains bearish as traders await the Fed minutes.
goTop
quote