


Bitcoin Price Forecast: BTC holds recent gains above 50-day EMA amid improving momentum
- Bitcoin finds support around the 50-day EMA at around $64,300 on Tuesday after gaining 2.5% the previous day.
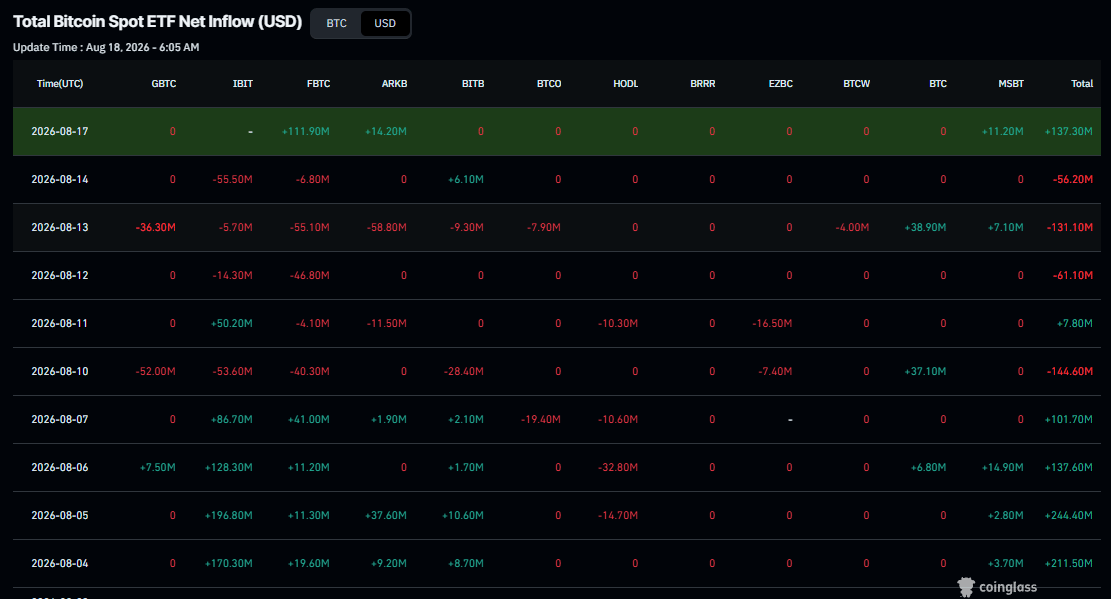
- US-listed spot ETF recorded an inflow of over $137 million on Monday, signaling early signs of optimism.
- Middle East tensions continue to weigh on risk sentiment and could limit BTC’s upside.
Bitcoin (BTC) slides slightly but holds most of the recent gains, reclaiming the 50-day Exponential Moving Average (EMA) at $64,300 at the time of writing on Tuesday after rising 2.5% the previous day. The recovery is supported by renewed institutional demand, with over $137 million in ETFs inflows on Monday. However, persistent Middle East tensions continue to weigh on broader risk sentiment, limiting the Crypto King’s upside.
Institutional demand returns
Institutional demand started the week on a positive note. Coinglass data showed spot ETFs recorded an inflow of $137.30 million on Monday, snapping three days of outflows since last week.
On the corporate front, Strategy announced in an X post on Monday that the firm increased its USD Reserve by $150 million, bringing total reserves to $4.80 billion. The company also announced that it repurchased $132 million of STRC shares under its Digital Credit Securities Repurchase Program.
Meanwhile, the firm did not purchase or sell Bitcoin last week, keeping its total holdings at 840,447 BTC. These developments highlight that Strategy is more focused on strengthening liquidity and managing its capital structure amid ongoing market uncertainty.
Middle East uncertainty continues to cap BTC
The United Kingdom Maritime Trade Operations (UKMTO) said on Tuesday that a vessel was struck by an unknown projectile while transiting outbound in the Strait of Hormuz, causing engine room damage and a crew casualty, with the remaining crew being assisted by the Omani Coast Guard, Reuters reported.
On Monday, US President Donald Trump said that he is not interested in renewing the expiring agreement with Iran.
Meanwhile, Iran’s Foreign Ministry spokesman Esmail Baghaei stated that a deal has been elusive due to security complexities and the “obstructionist behavior of destructive elements,” adding that the US must remove its blockade.
These developments of uncertainty have kept Middle East tensions elevated, which could jeopardize a possible US-Iran peace deal. This could dampen traders’ risk appetite, boost safe-haven assets such as the US Dollar (USD), and limit BTC’s upside.
Bitcoin technical outlook: Momentum indicators show mild bullish strength
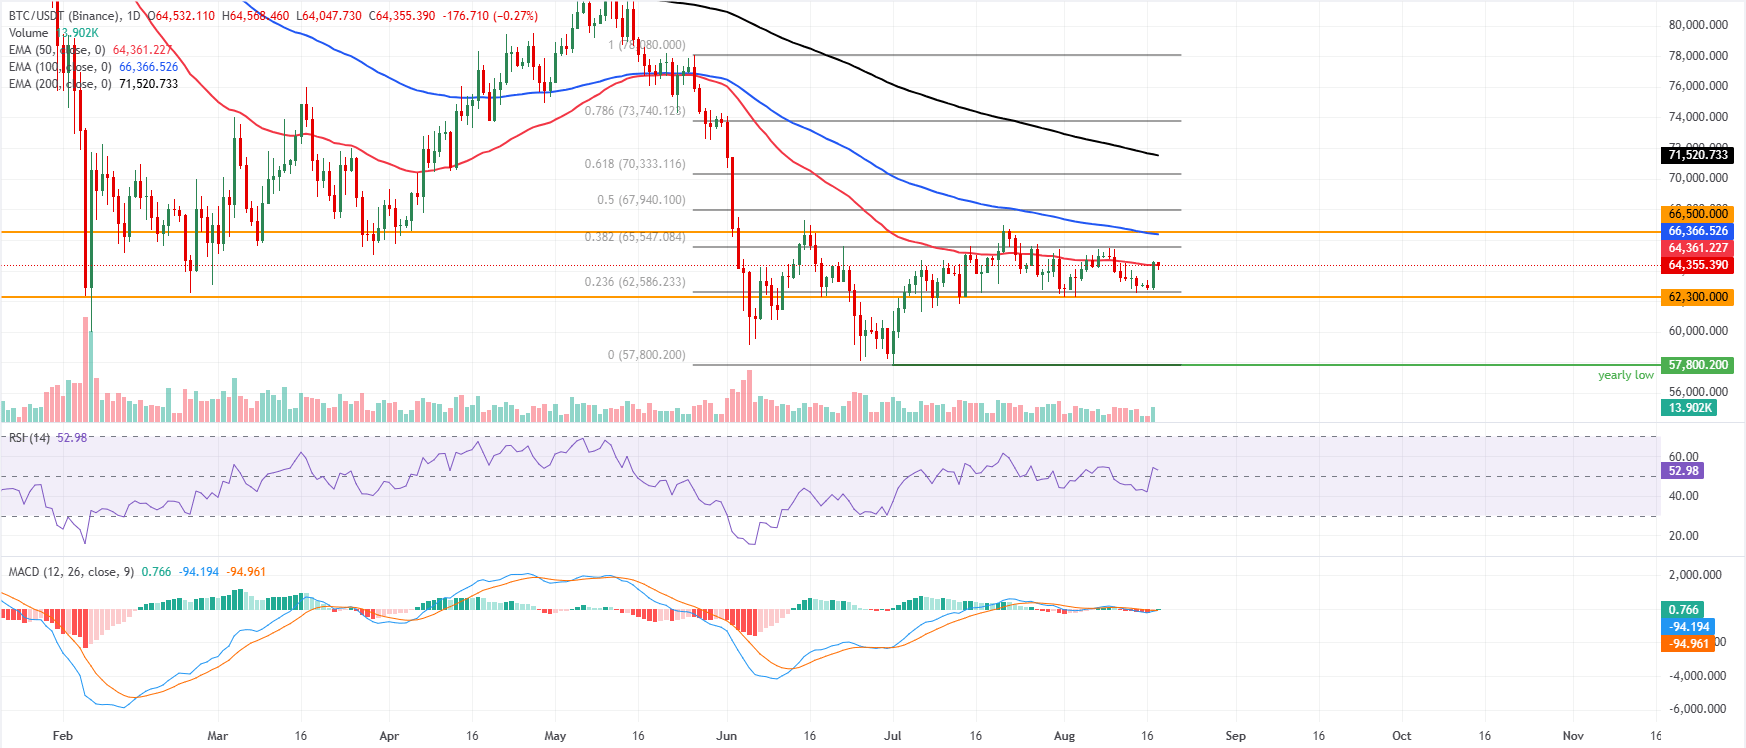
Bitcoin price trades at $64,361 on Tuesday, holding just above the 50-day EMA at $64,355 while sitting beneath the 100-day EMA at $66,366, which acts as immediate overhead supply.
The broader retracement structure also weighs on price, with the 38.2% Fibonacci level at $65,547 (drawn from May 26 high of $78,080 to the yearly low of $57,800 set on July 1) and the 100-day EMA at $66,366, reinforcing resistance above. The Relative Strength Index (RSI) near 51 hints at only modest, neutral-to-bullish momentum and the Moving Average Convergence Divergence (MACD) hovering slightly below zero suggests a lack of strong directional drive.
On the topside, initial resistance is located at the mentioned $65,547, followed by $66,366. Further up, the horizontal barrier at $66,500 and the 50% retracement at $67,940 emerge.
On the downside, immediate demand appears near the 50-day EMA at $64,355, followed by the 23.6% Fibonacci retracement at $62,586, ahead of the horizontal support at $62,300.
(The technical analysis of this story was written with the help of an AI tool. Know more.)
Bitcoin, altcoins, stablecoins FAQs
Bitcoin is the largest cryptocurrency by market capitalization, a virtual currency designed to serve as money. This form of payment cannot be controlled by any one person, group, or entity, which eliminates the need for third-party participation during financial transactions.
Altcoins are any cryptocurrency apart from Bitcoin, but some also regard Ethereum as a non-altcoin because it is from these two cryptocurrencies that forking happens. If this is true, then Litecoin is the first altcoin, forked from the Bitcoin protocol and, therefore, an “improved” version of it.
Stablecoins are cryptocurrencies designed to have a stable price, with their value backed by a reserve of the asset it represents. To achieve this, the value of any one stablecoin is pegged to a commodity or financial instrument, such as the US Dollar (USD), with its supply regulated by an algorithm or demand. The main goal of stablecoins is to provide an on/off-ramp for investors willing to trade and invest in cryptocurrencies. Stablecoins also allow investors to store value since cryptocurrencies, in general, are subject to volatility.
Bitcoin dominance is the ratio of Bitcoin's market capitalization to the total market capitalization of all cryptocurrencies combined. It provides a clear picture of Bitcoin’s interest among investors. A high BTC dominance typically happens before and during a bull run, in which investors resort to investing in relatively stable and high market capitalization cryptocurrency like Bitcoin. A drop in BTC dominance usually means that investors are moving their capital and/or profits to altcoins in a quest for higher returns, which usually triggers an explosion of altcoin rallies.
Recommended Articles


