


Ripple and Stellar outlook: Stay under pressure as cautious sentiment builds
- XRP remains under pressure, trading around the $1.00 support zone, where a close below suggests a deeper correction.
- XLM is trading at $0.159 on Thursday, extending its decline below the short- and medium-term EMAs.
- Mixed derivatives metrics and on-chain metrics suggest cautious and indecisive sentiment among traders.
Ripple (XRP) and Stellar (XLM) remain under pressure, with both altcoins correcting slightly so far this week. XRP nears the key $1.00 support zone on Thursday, while XLM trades below critical technical levels. Mixed derivatives and on-chain metrics suggest cautious sentiment, leaving both tokens vulnerable to further downside while offering hope for a potential recovery.
Mixed sentiment among traders
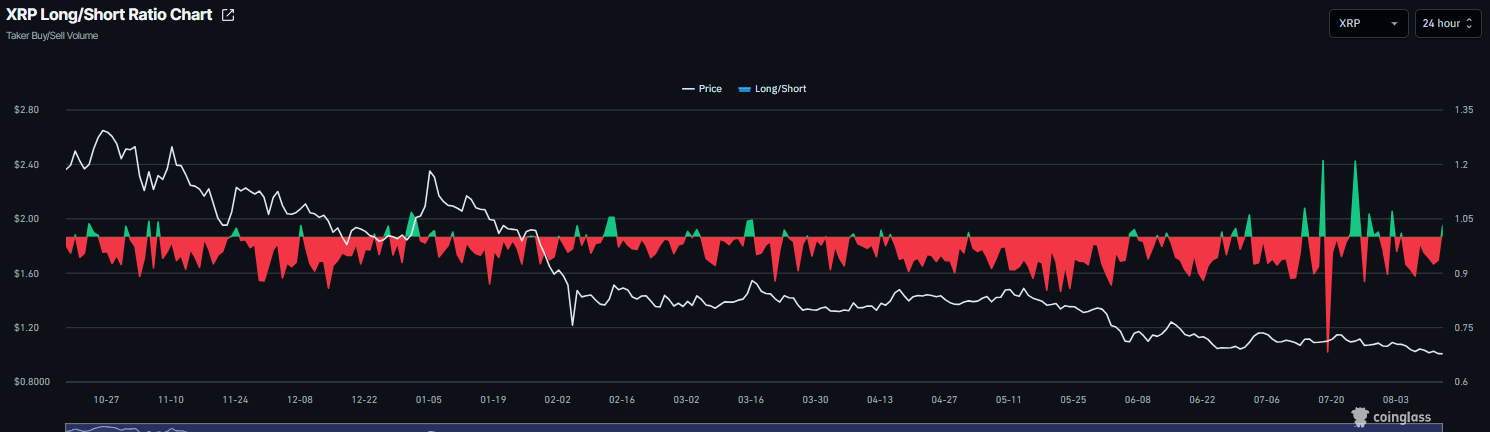
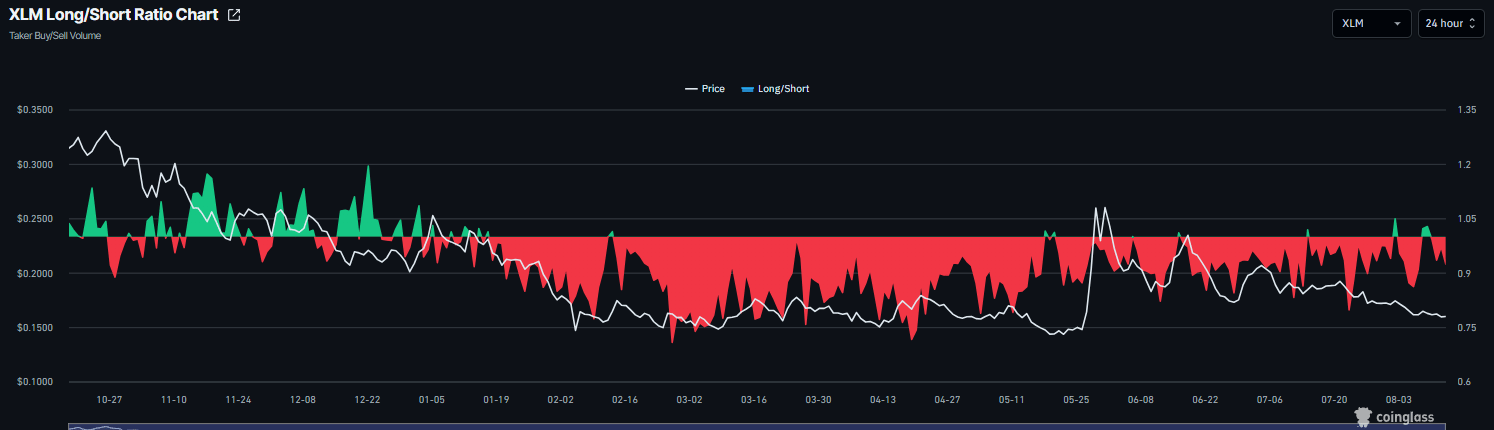
Derivatives data shows mixed sentiment with a mild bullish tilt among traders. CoinGlass’ long-to-short ratio for XRP reads 1.03 on Thursday. A ratio above one indicates bullish sentiment, as traders are betting the asset prices will rise. Meanwhile, the long-to-short ratio for XLM reads 0.92 on Thursday, nearing the lowest level in over a month. A ratio below one indicates bearish sentiment, as traders are betting the asset prices will fall.
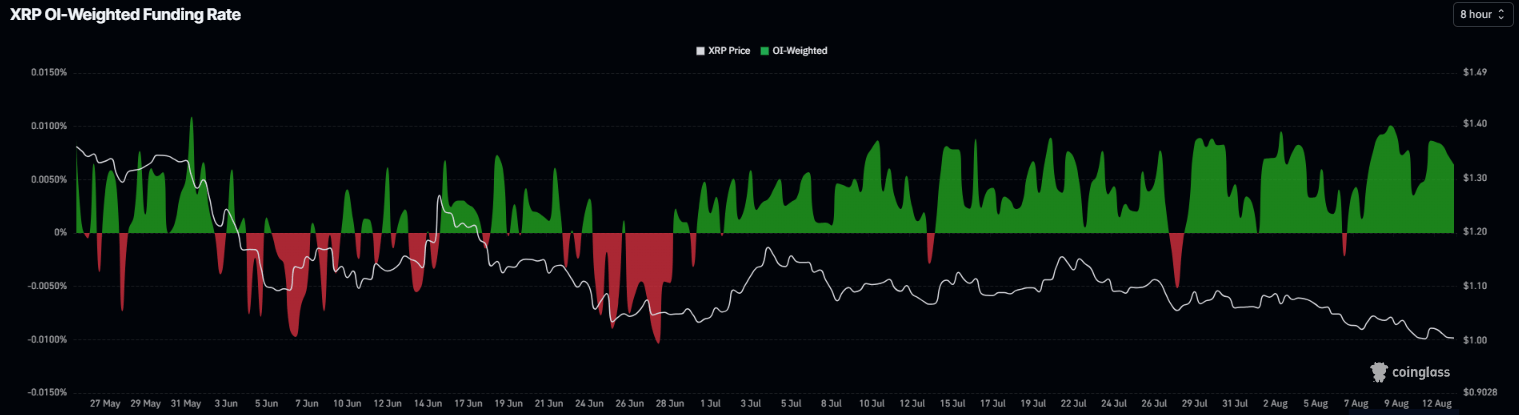
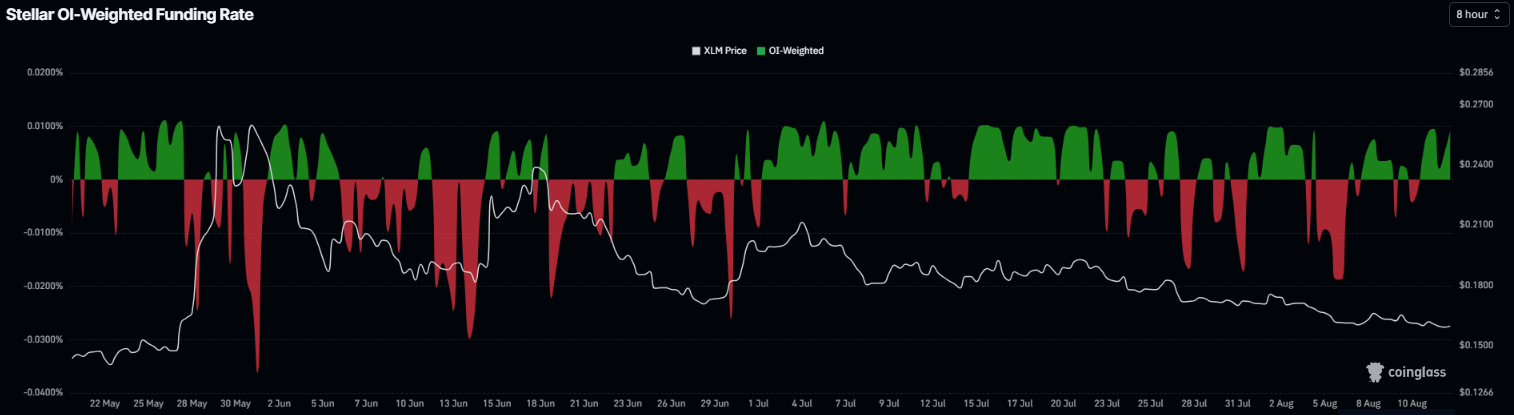
However, the funding rate for both XRP and XLM shows improving sentiment. For both altcoins, the rates read positive 0.0064% and 0.0092%, respectively, on Thursday. These positive rates indicate that long traders are paying shorts and reflect a bullish bias.
Cautious optimism among traders
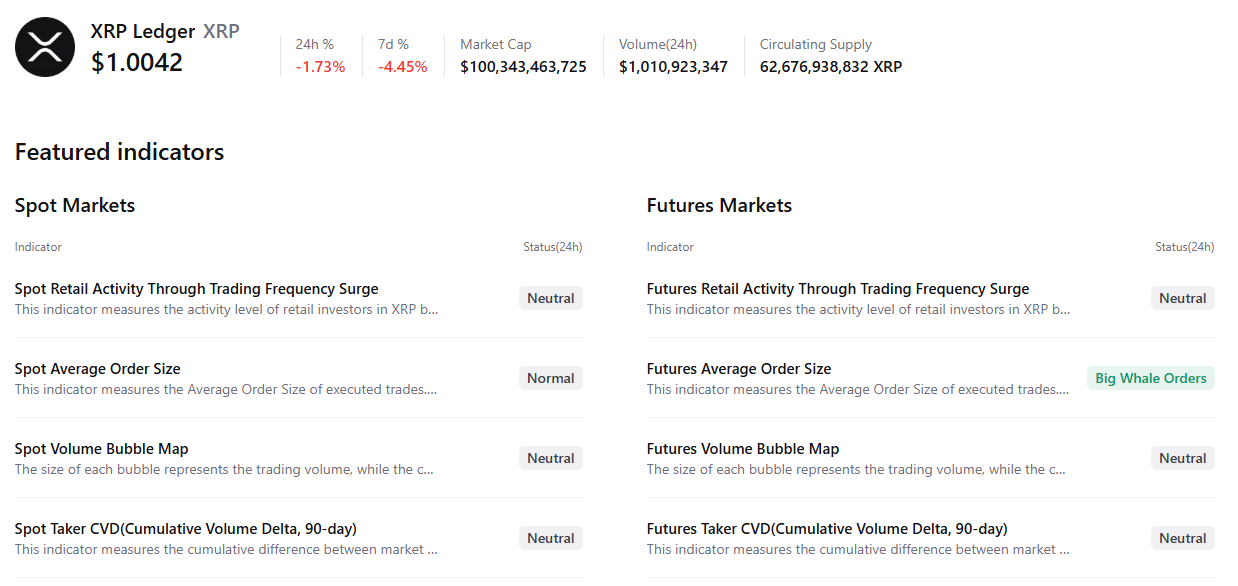
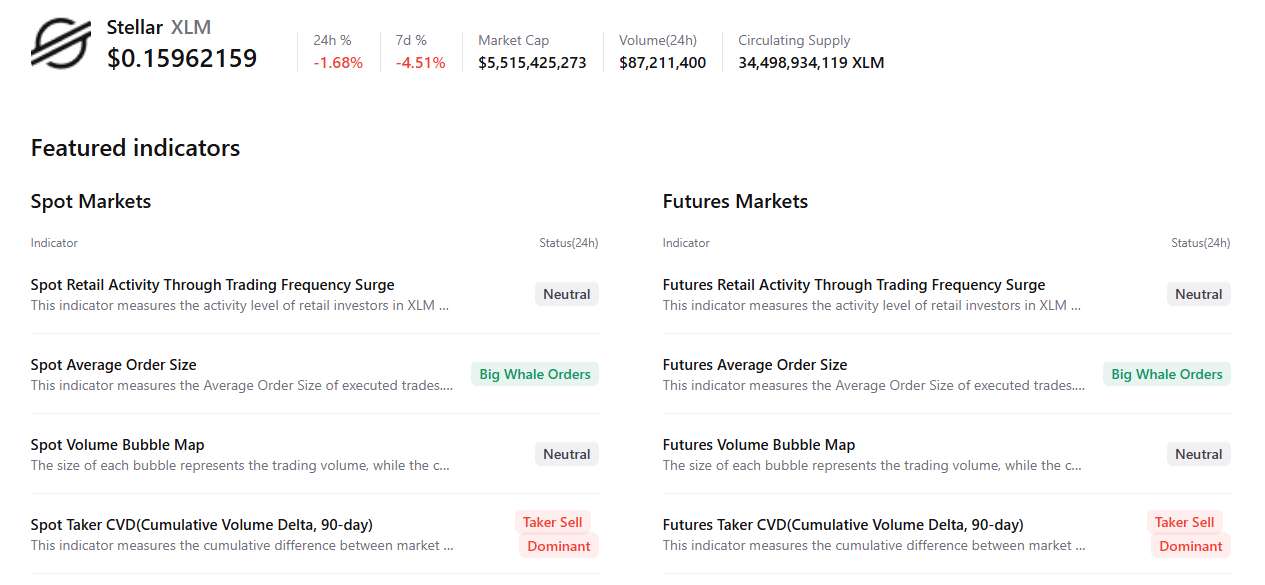
CryptoQuant’s summary data shows cautious optimism. XRP’s futures markets show large whale orders, while other metrics remain neutral, supporting a potential recovery. However, XLM shows selling-side dominance in both markets, and large whale orders, hinting at cautious sentiment among traders.
XRP technical outlook: Nears key $1 support
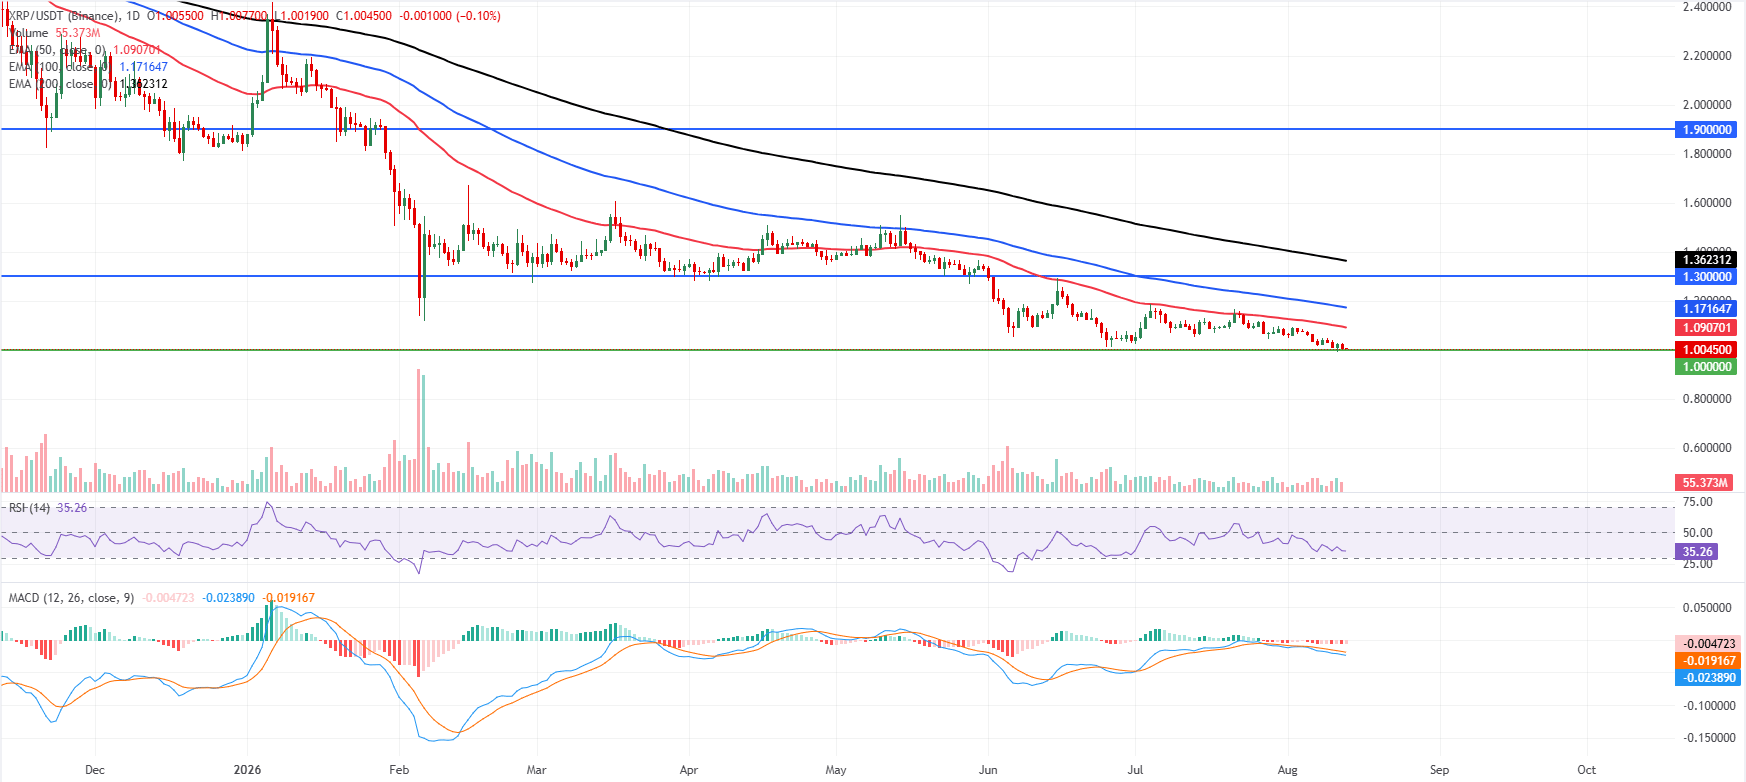
XRP price trades at $1.004 on Thursday, keeping a bearish near-term bias as price holds under the 50-day Exponential Moving Average (EMA) at $1.090, the 100-day EMA at $1.171 and the 200-day EMA at $1.362. The cluster of EMAs overhead suggests rallies remain capped, while the Relative Strength Index (RSI) near 35 hints at persisting downside pressure. The Moving Average Convergence Divergence (MACD) stays in negative territory, reinforcing a weak tone despite the pair hovering just above the $1.000 psychological area.
On the downside, immediate support is located at the horizontal level around $1.000, where buyers could attempt to slow the decline.
On the topside, initial resistance aligns with the 50-day EMA at $1.090, followed by the 100-day EMA at $1.171 and the prior horizontal barrier at $1.300, before a more distant cap emerges at the 200-day EMA near $1.362 and the higher resistance line at $1.900.
XLM technical outlook: Key EMAs hold as resistance
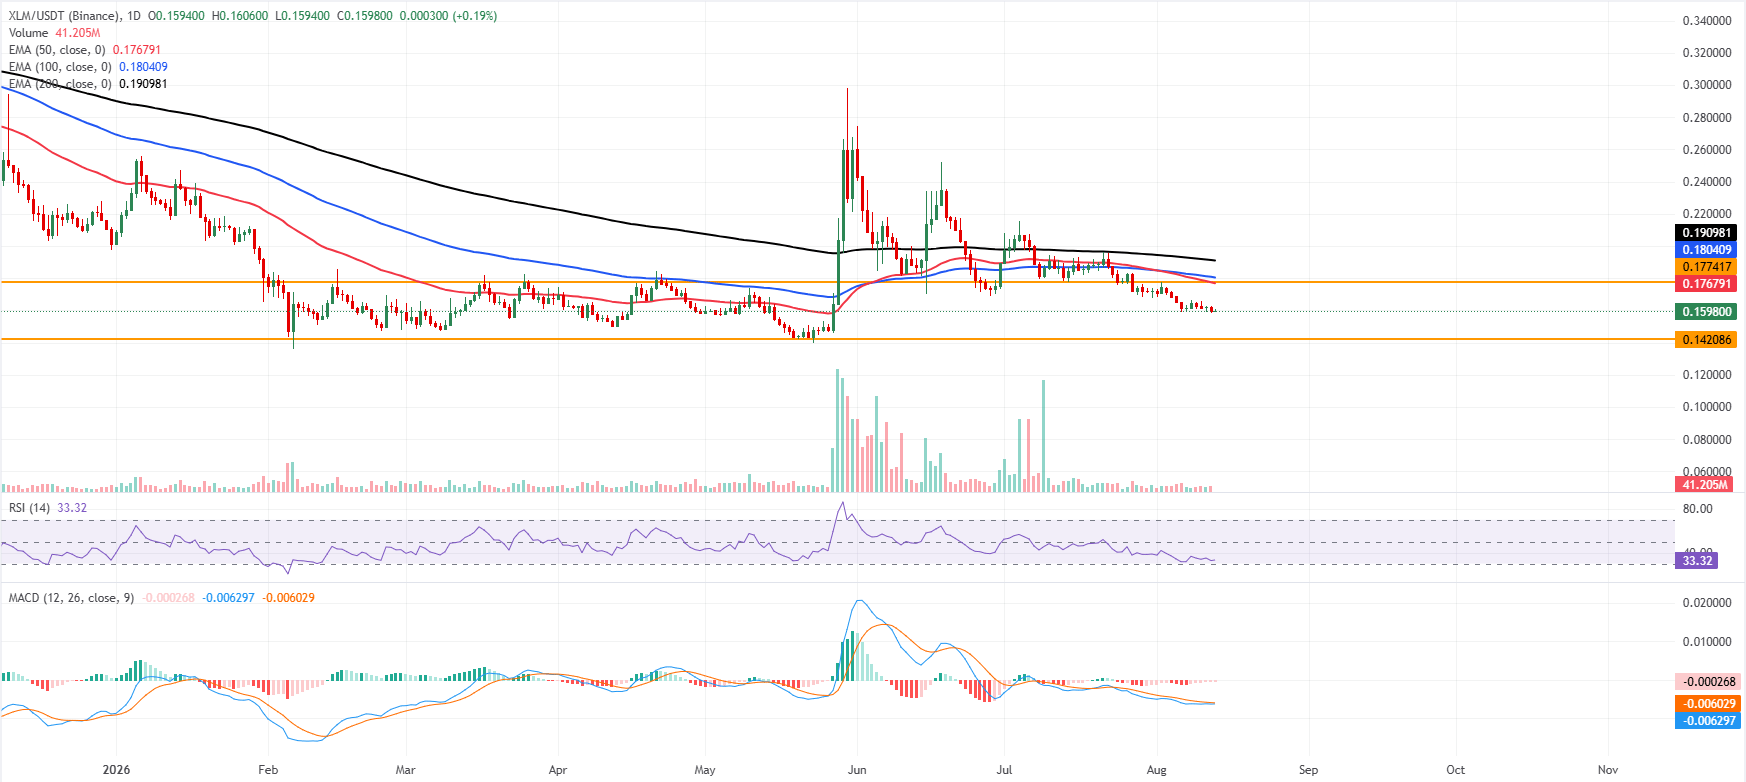
XLM price trades at $0.159 on Thursday, maintaining a bearish near-term bias as it sits below the key EMAs. The 50-day EMA at $0.176, the 100-day EMA at $0.180 and the 200-day EMA at $0.190 all converge overhead as layered resistance, suggesting rallies are likely to be capped before a more meaningful recovery can develop.
Momentum remains soft, with the RSI hovering near 33, close to oversold territory, while the MACD stays in negative territory and reinforces the prevailing downside pressure.
On the topside, initial resistance aligns with the 50-day EMA around $0.176, followed closely by the horizontal barrier at $0.177, forming a nearby supply zone that bulls would need to clear to ease selling pressure. Above that, the 100-day EMA at $0.180 opens the way toward the more strategic 200-day EMA at $0.190.
On the downside, the next meaningful support emerges at the prior horizontal floor near $0.142, where buyers could attempt to arrest the decline if the current bearish tone extends.
(The technical analysis of this story was written with the help of an AI tool. Know more.)
Recommended Articles


