Pi Network Price Forecast: PI holds at key support as broader market declines

Source Fxstreet
  • Pi Network holds steady around $0.08745 on Tuesday after two consecutive days of losses.
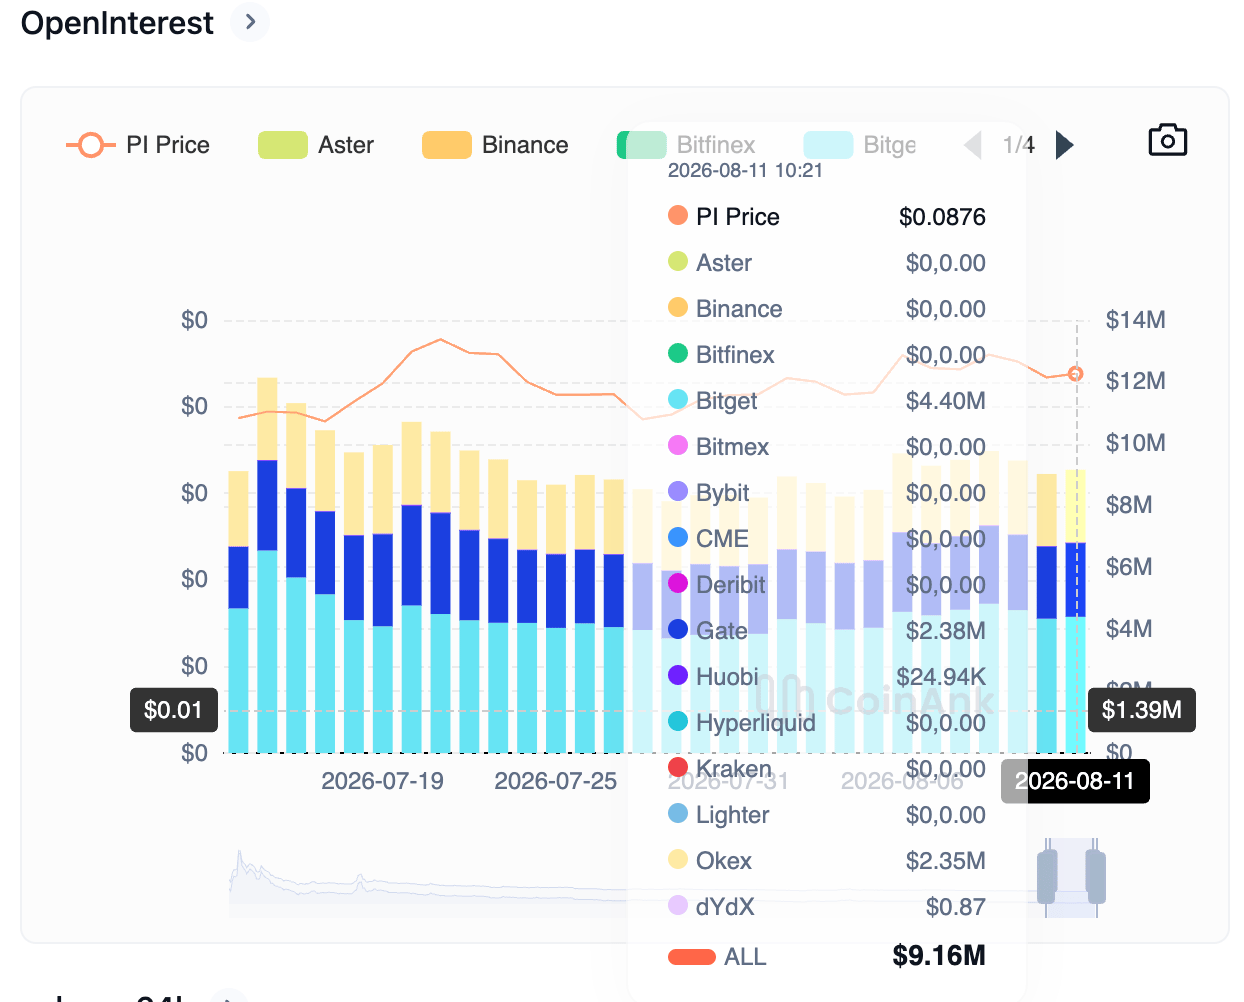
  • PI futures Open Interest remains at $9.16 million as the broader crypto market sentiment deteriorates.
  • The technical outlook for PI suggests a mild downside bias as momentum remains neutral to bearish.

Pi Network (PI) steadies around $0.08745 on Tuesday after two consecutive days of losses, capped below the $0.1000 psychological threshold. Retail demand in PI derivatives remains firm, with Open Interest above $9 million, even as broader crypto market sentiment wanes. Technically, PI faces a steeper correction, as it lacks upside momentum to support a near-term recovery. 

Demand in PI futures holds firm amid declining market sentiment

The broader crypto market is subject to recurring bearish catalysts, maintaining a downside bias. The recent pullback in Bitcoin (BTC) price, with MARA holdings and Strategy reducing their exposure, as previously reported by FXStreet, weighs on altcoins. 

Despite broader market pressure, CoinAnk data shows PI futures Open Interest at $9.16 million, up from $9.02 million the previous day, indicating a mild buildup in positions. 
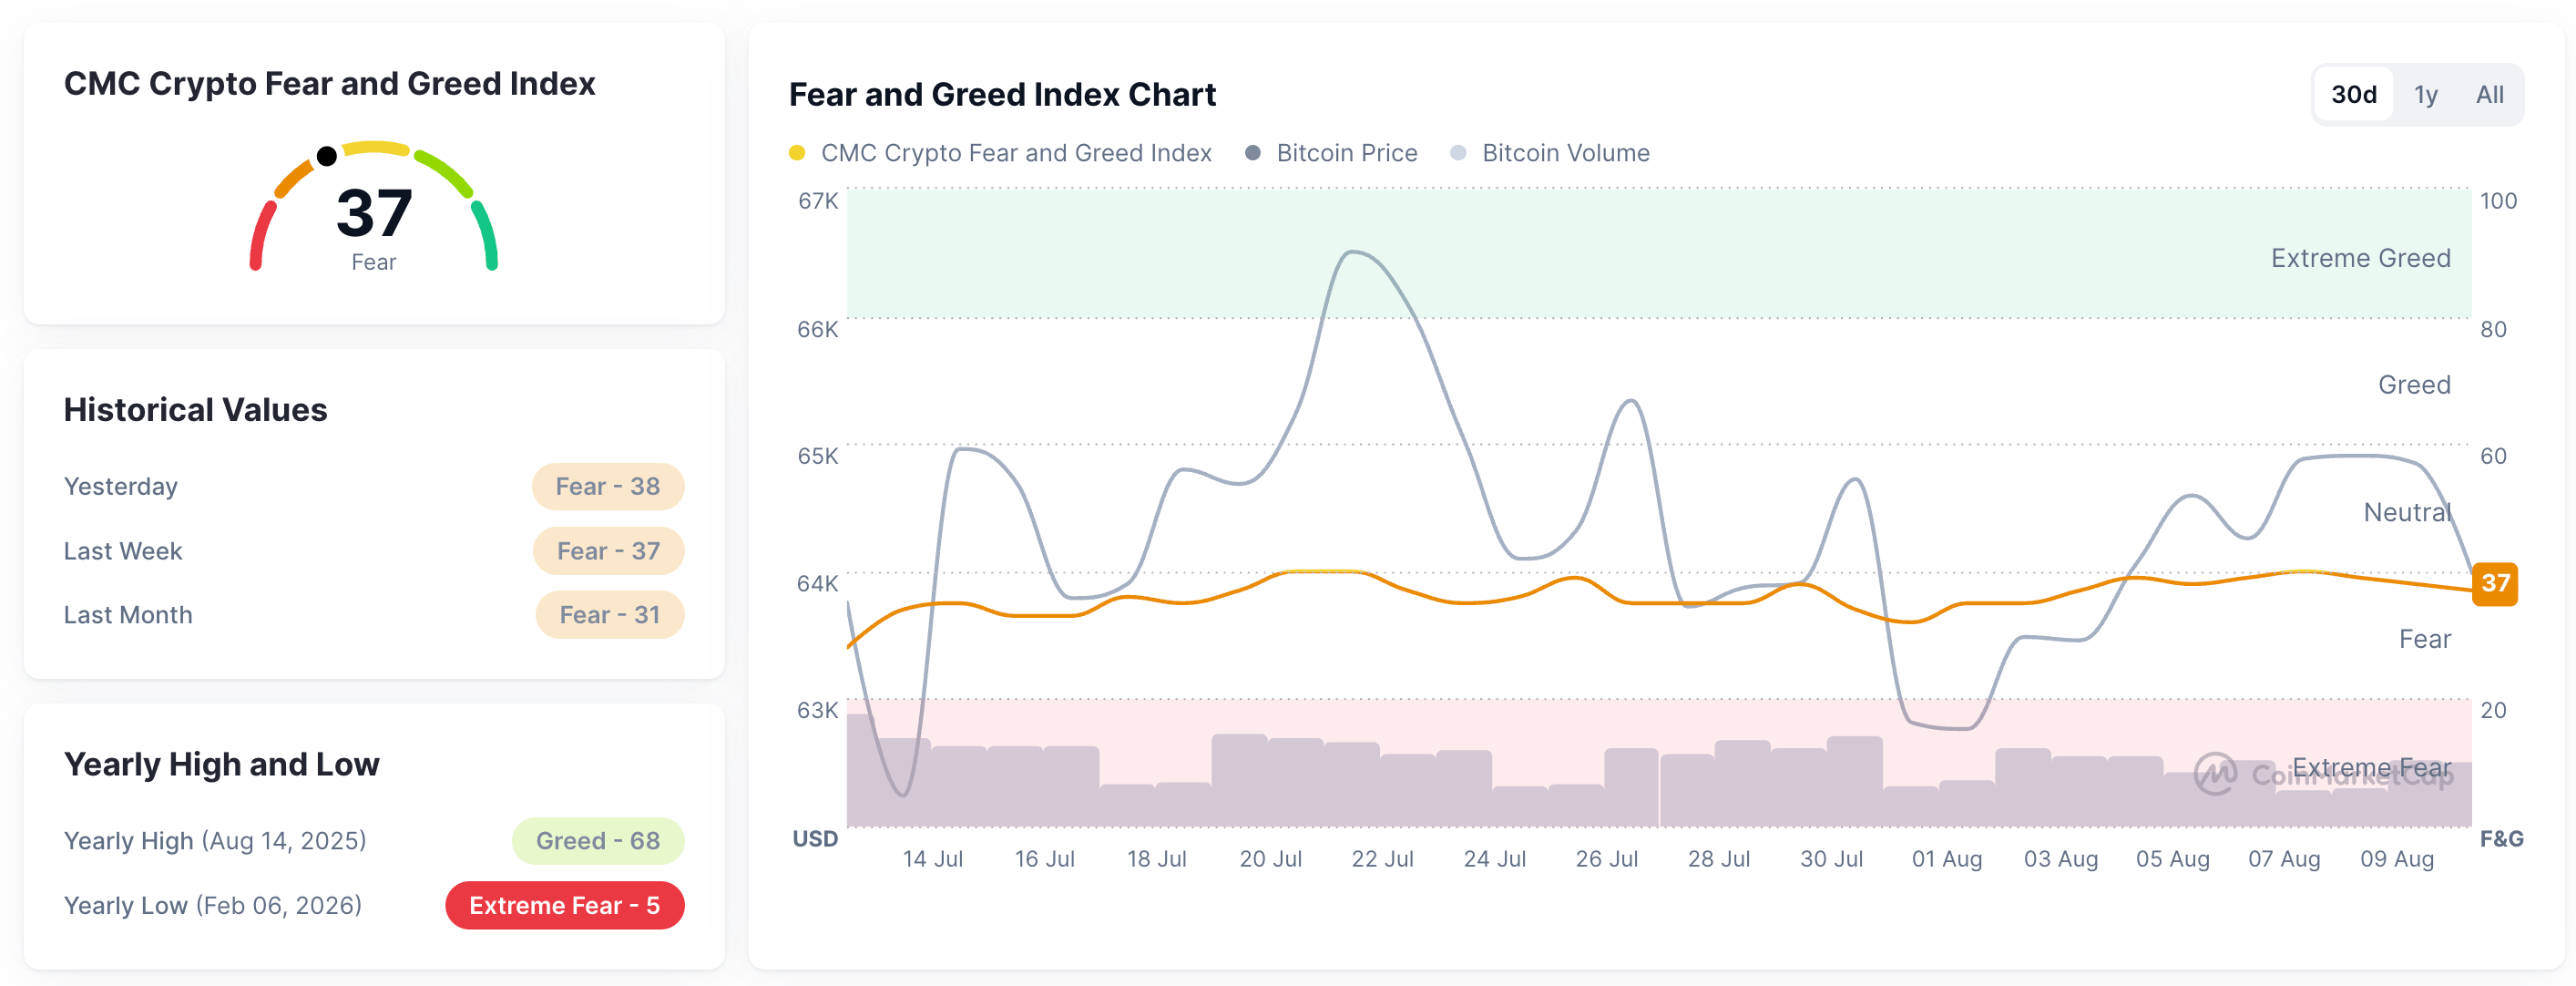
Fear and Greed Index. Source: CoinMarketCap
PI token Open Interest chart. Source: CoinAnk

Technical outlook: Will PI perform a post-retest rebound to $0.10?

Pi Network extends its decline well below the $0.1000 threshold, which serves as the primary overhead barrier and keeps the broader tone bearish. At the time of writing, PI tests the broken downward trendline near the 78.6% Fibonacci retracement level (measured from $0.13410 to $0.07032) at $0.08397.

Momentum is mixed on the daily chart, as the Relative Strength Index (RSI) at 26 sits in oversold territory, hinting at stretched downside conditions, while the Moving Average Convergence Divergence (MACD) indicator holds marginally above its signal line, suggesting that selling pressure may be losing intensity.

Looking up, a rebound from the $0.08397 support zone could test the 50% retracement at $0.10221, followed by the 23.6% Fibonacci retracement level at $0.11905.
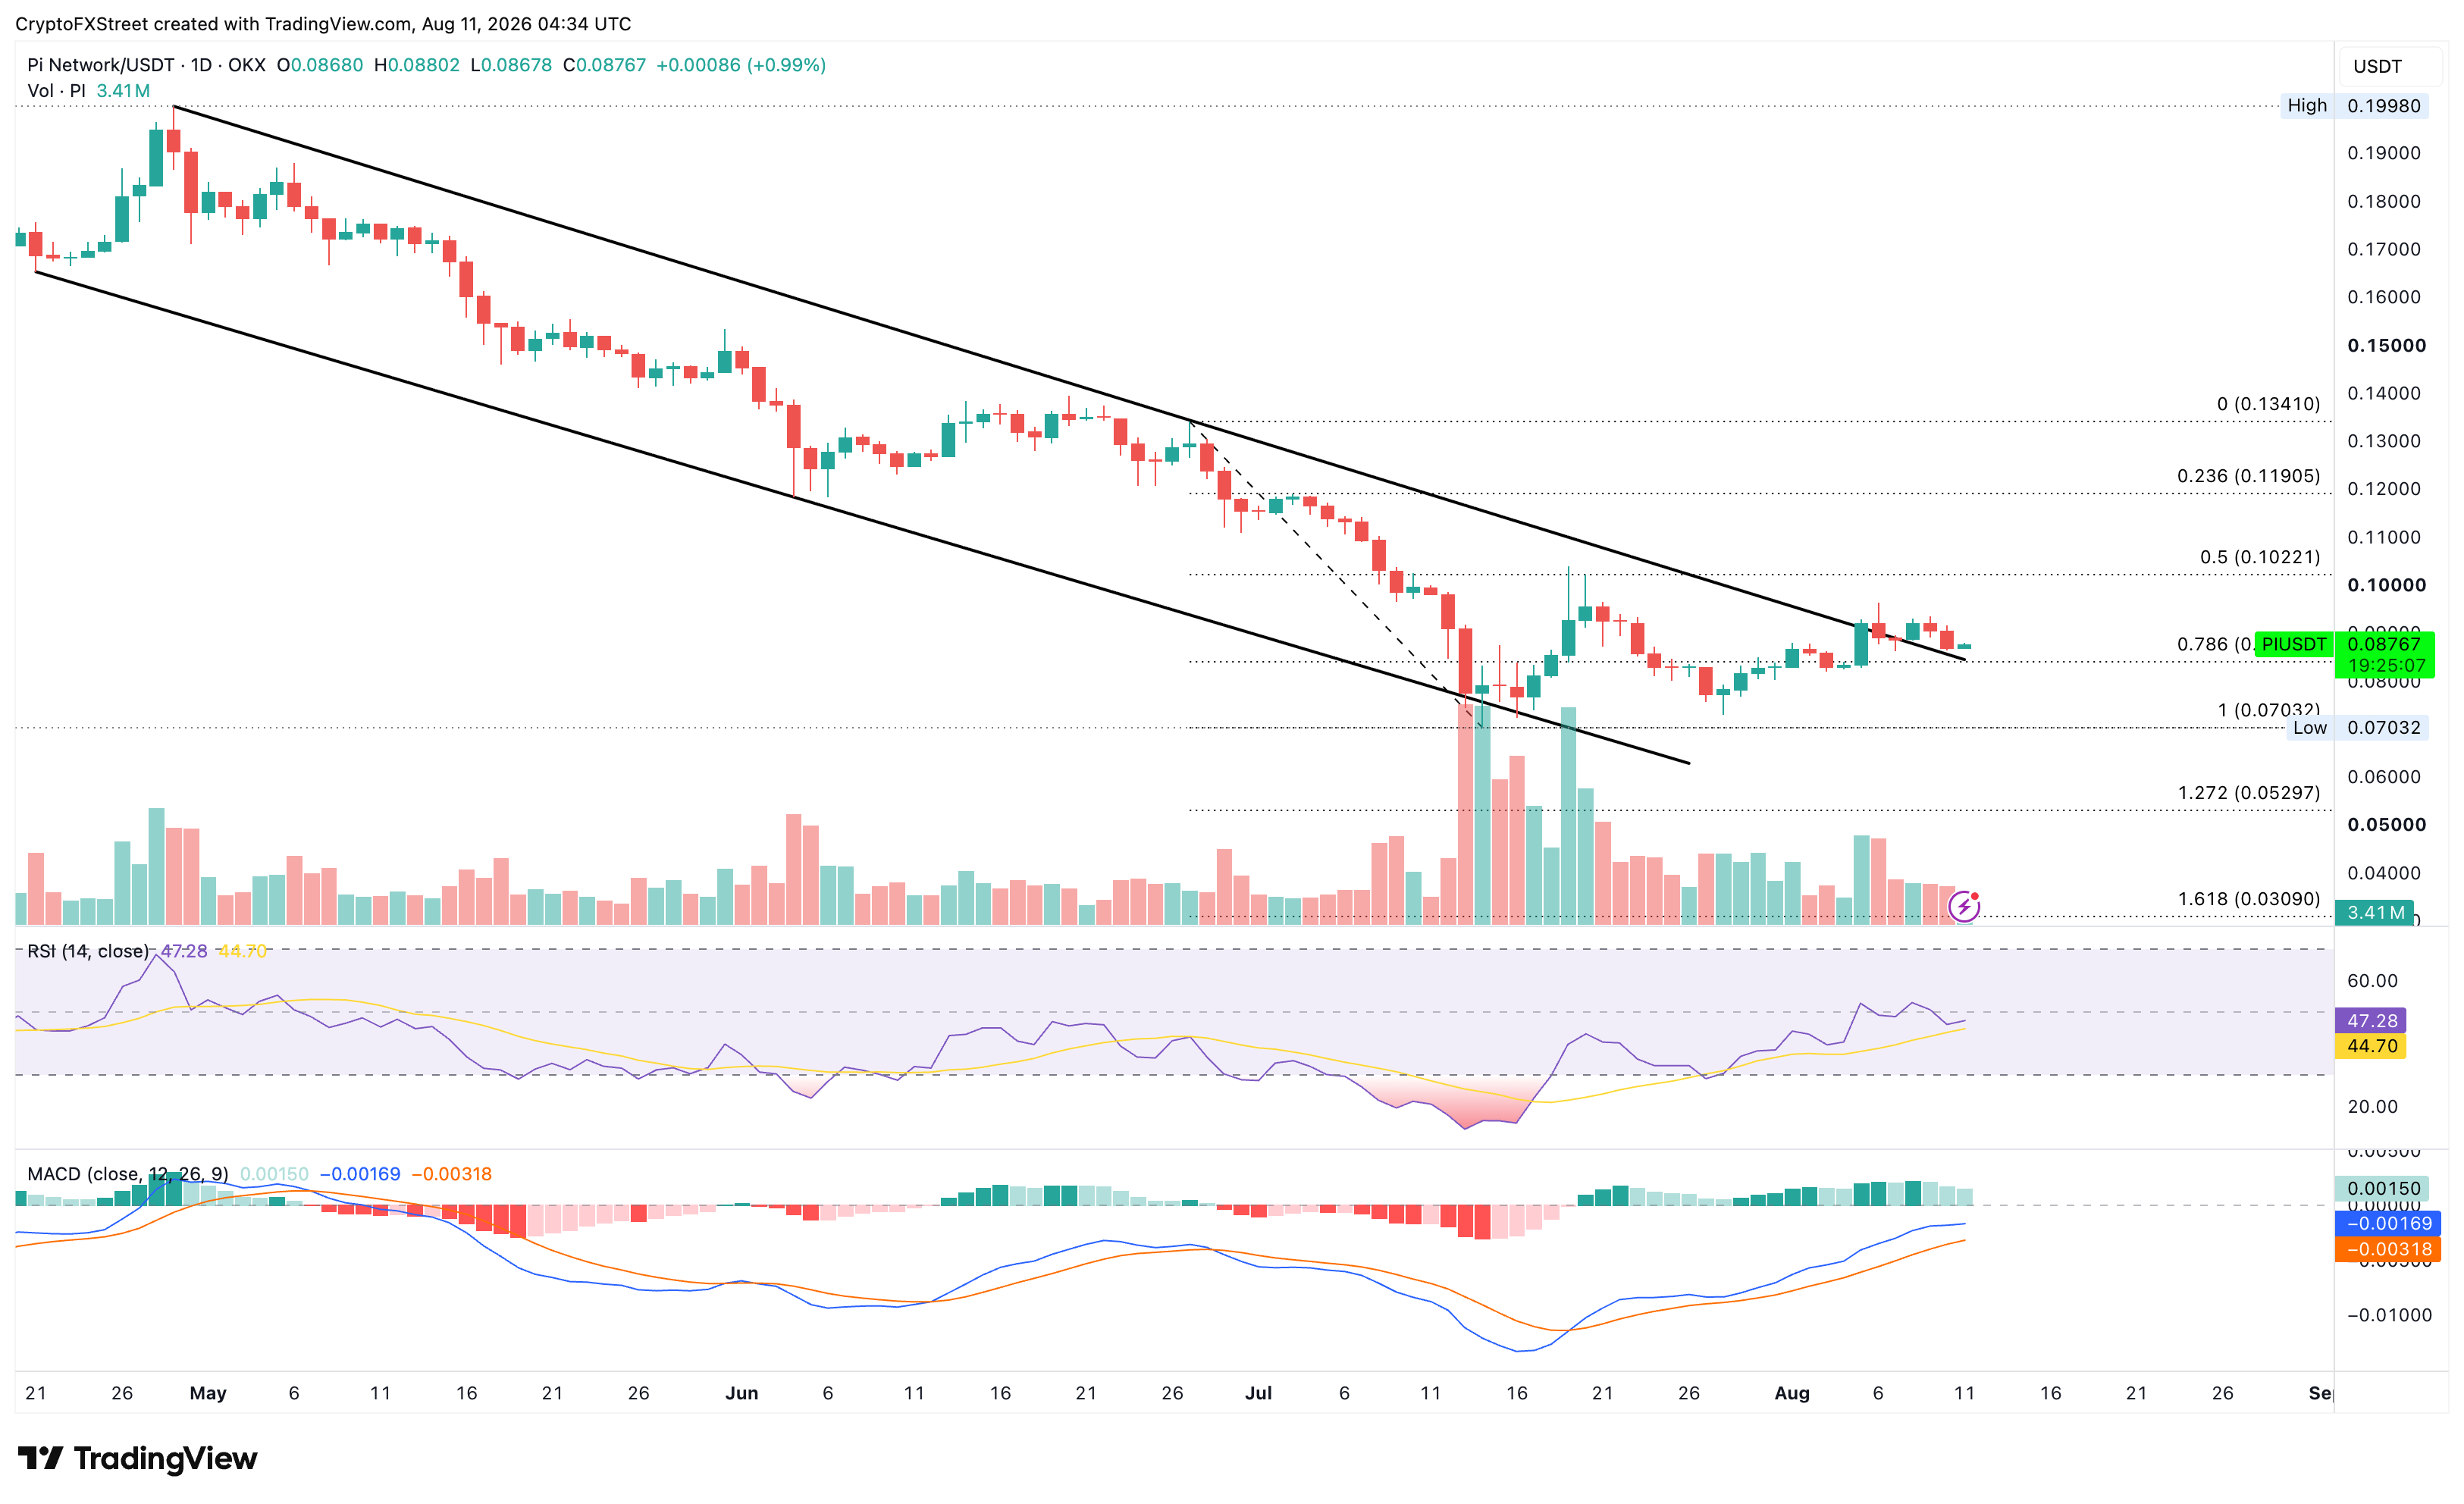
PI/USDT daily price chart.

On the downside, a slip below $0.08397 could nullify rebound chances, extending a potential decline toward the $0.07000 round figure.

(The technical analysis of this story was written with the help of an AI tool. Know more.)

Disclaimer: For information purposes only. Past performance is not indicative of future results.
placeholder
XRP Price Prediction for July 2026: Can Buyers Finally Break the Downtrend?XRP (XRP) price trades near $1.05, caught between a year-long downtrend and a sudden burst of buying.July has historically rewarded XRP holders. This year the month arrives with on-chain accumulation
Author  Beincrypto
Jun 30, Tue
XRP (XRP) price trades near $1.05, caught between a year-long downtrend and a sudden burst of buying.July has historically rewarded XRP holders. This year the month arrives with on-chain accumulation
placeholder
Smart Money is Leaving Nvidia for This AI Chip StockNvidia stock price keeps sliding, yet the usual dip buyers are missing. Institutional money flow on the stock is the most negative of any major chip name, which means big investors are stepping back i
Author  Beincrypto
Jun 30, Tue
Nvidia stock price keeps sliding, yet the usual dip buyers are missing. Institutional money flow on the stock is the most negative of any major chip name, which means big investors are stepping back i
placeholder
What to Expect From Ethereum (ETH) in July 2026Ethereum (ETH) enters July 2026 trading near $1,570, close to multi-month lows, after recording its first run of three consecutive red quarterly candles in its history.On-chain data and price charts n
Author  Beincrypto
Jul 01, Wed
Ethereum (ETH) enters July 2026 trading near $1,570, close to multi-month lows, after recording its first run of three consecutive red quarterly candles in its history.On-chain data and price charts n
placeholder
Intel Price Forecast: Nvidia Picked Xeon 6, Invested $5B, Yet Analysts Still Trail INTCIntel Corporation (NASDAQ: INTC) sits at $140.05, holding firm on the ascending trendline within the 2H timeframe. The RSI indicator is currently reading 55.21, positioning it as neutral-
Author  TradingKey
Jul 02, Thu
Intel Corporation (NASDAQ: INTC) sits at $140.05, holding firm on the ascending trendline within the 2H timeframe. The RSI indicator is currently reading 55.21, positioning it as neutral-
placeholder
Brent Crude Oil Erases Entire War Premium, Falls 40% to Pre-War LevelsBrent crude oil has erased its entire war premium, sliding roughly 40% from its March peak near $120 to trade around $72.25 on Wednesday. The move returns oil to its pre-war support base.The retreat f
Author  Beincrypto
Jul 02, Thu
Brent crude oil has erased its entire war premium, sliding roughly 40% from its March peak near $120 to trade around $72.25 on Wednesday. The move returns oil to its pre-war support base.The retreat f
goTop
quote