


Pump.fun Price Forecast: PUMP rallies on steady revenue, buybacks, and burns
- Pump.fun is up nearly 3% so far on Tuesday, extending its fourth consecutive day of gains.
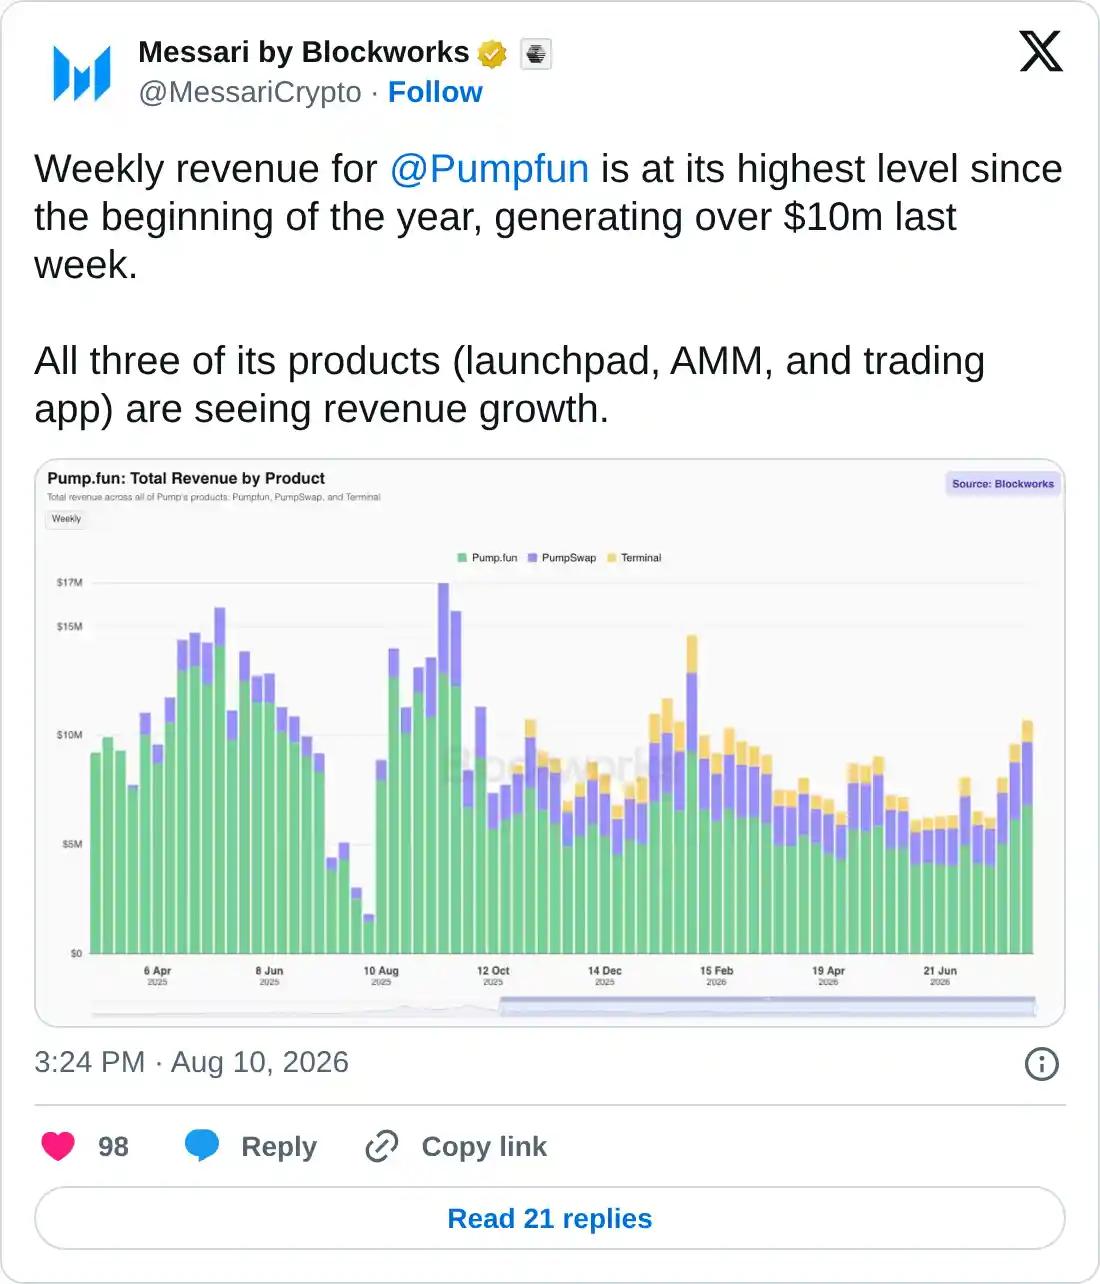
- Pump.fun’s weekly revenue hit an annual high of over $10 million last week, amid consistent token buybacks and burns.
- Retail demand for PUMP holds steady with rising Open Interest and funding rate.
Pump.fun (PUMP) is up nearly 3% so far on Tuesday, extending gains for the third consecutive day. A surge in weekly revenue, reaching an annual high last week, supports PUMP's recovery amid consistent token buybacks and burns. Retail demand holds firm for PUMP, with its futures Open Interest and funding rates rising. The technical outlook for PUMP is mildly bullish, though upside momentum is stretching into overbought territory.
PUMP extends gains on rising revenues, token burns, and buybacks
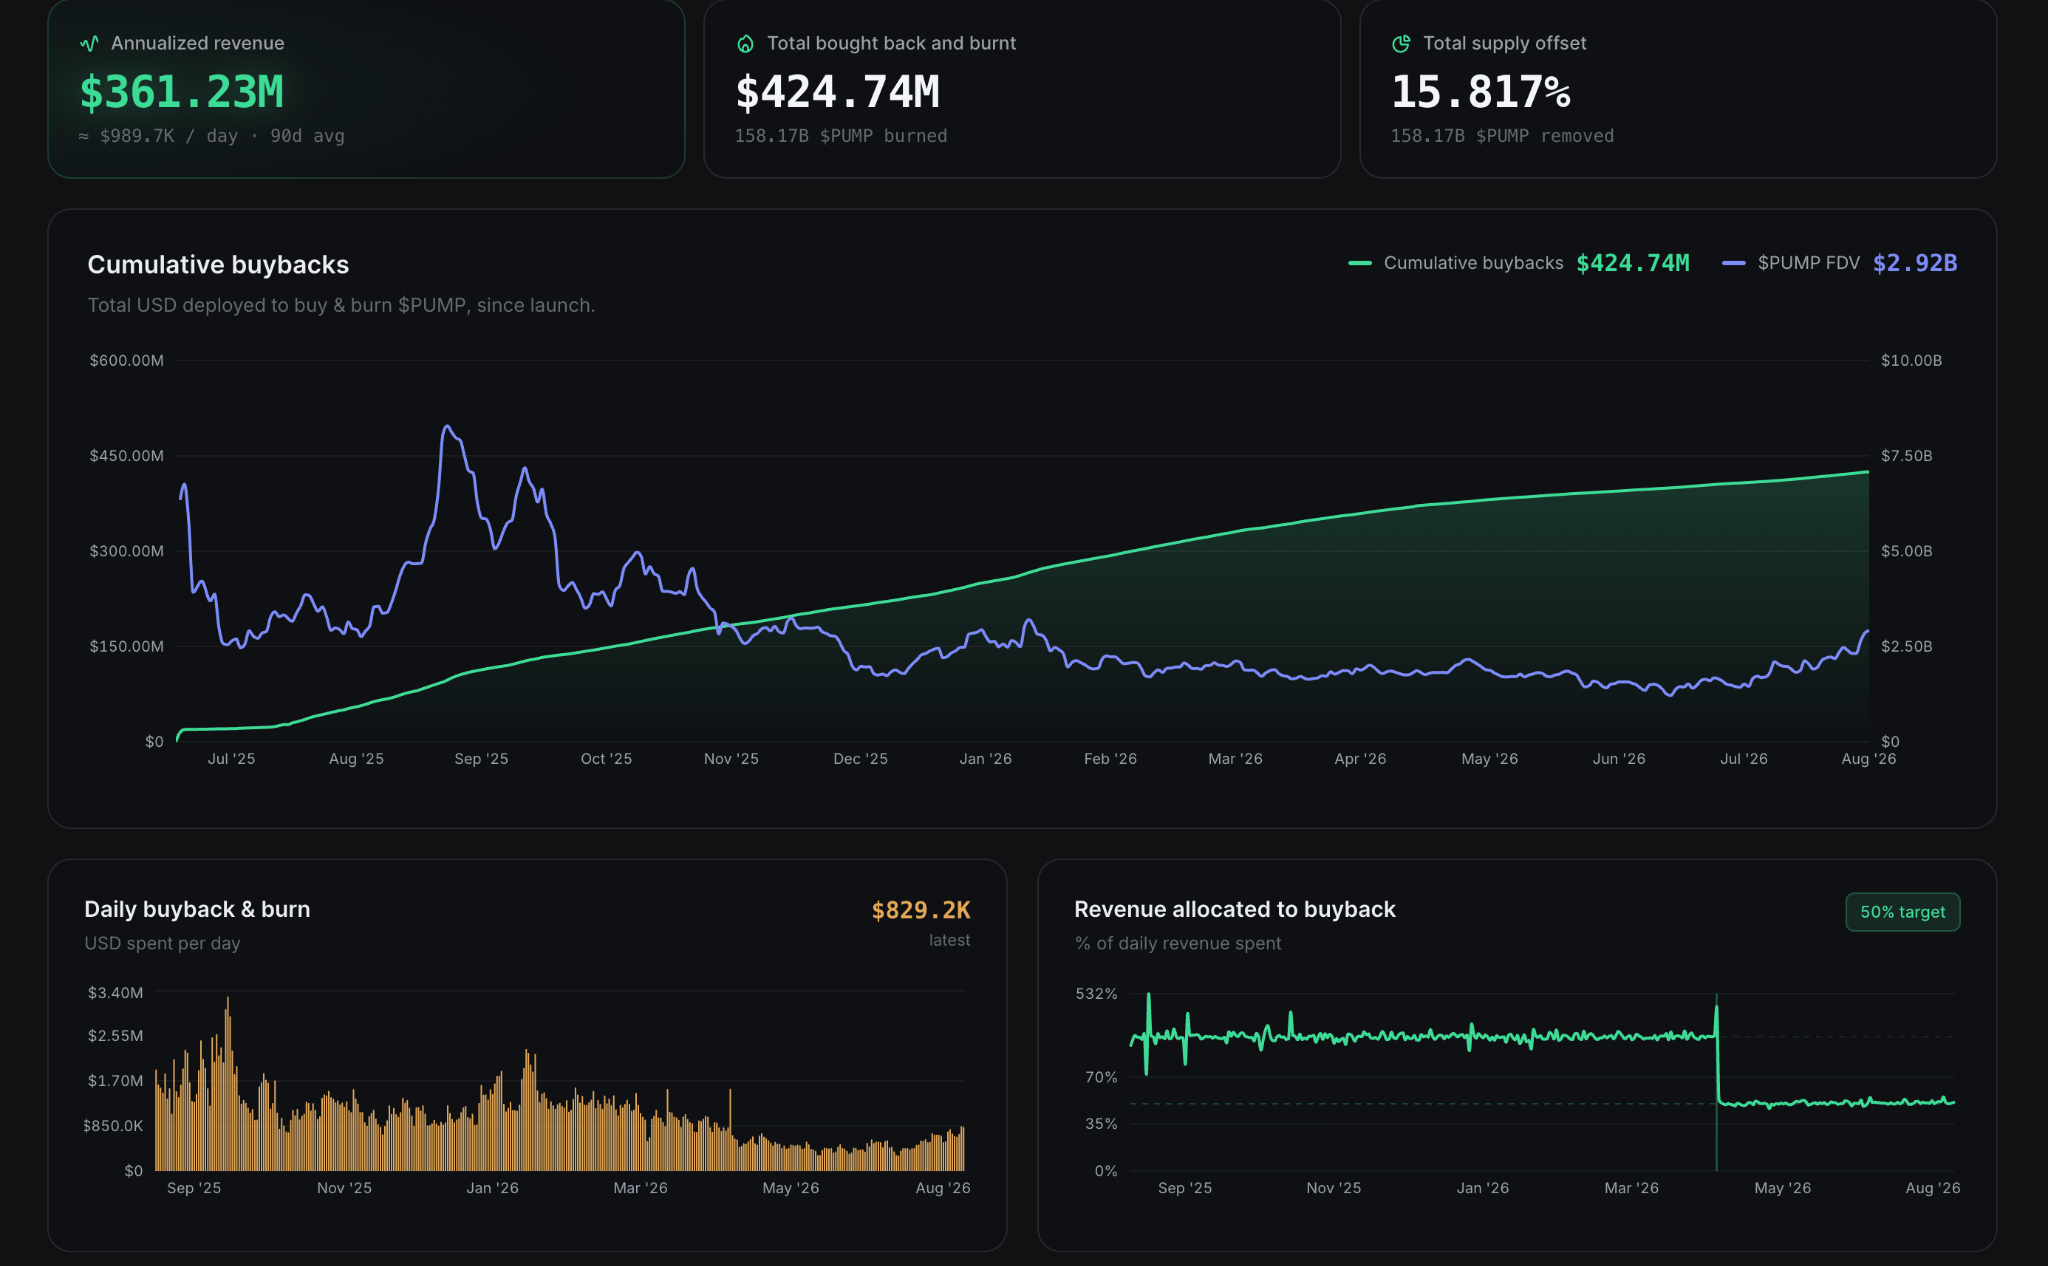
Weekly revenue of Pump.fun grossed over $10 million last week, reaching its annual high amid renewed user activity. The rise in revenue boosts token buybacks and burns, as 50% of it is allocated toward buybacks, resulting in reduced supply. Pump.fun data shows $829,200 of daily buyback and burn on Monday, leading to a cumulative buyback of $424.74 million, while the Fully Diluted Value (FDV) rose to $2.92 billion. So far, a total of 158.17 billion PUMP tokens have been bought back and burned, effectively reducing the total supply by 15.81%.
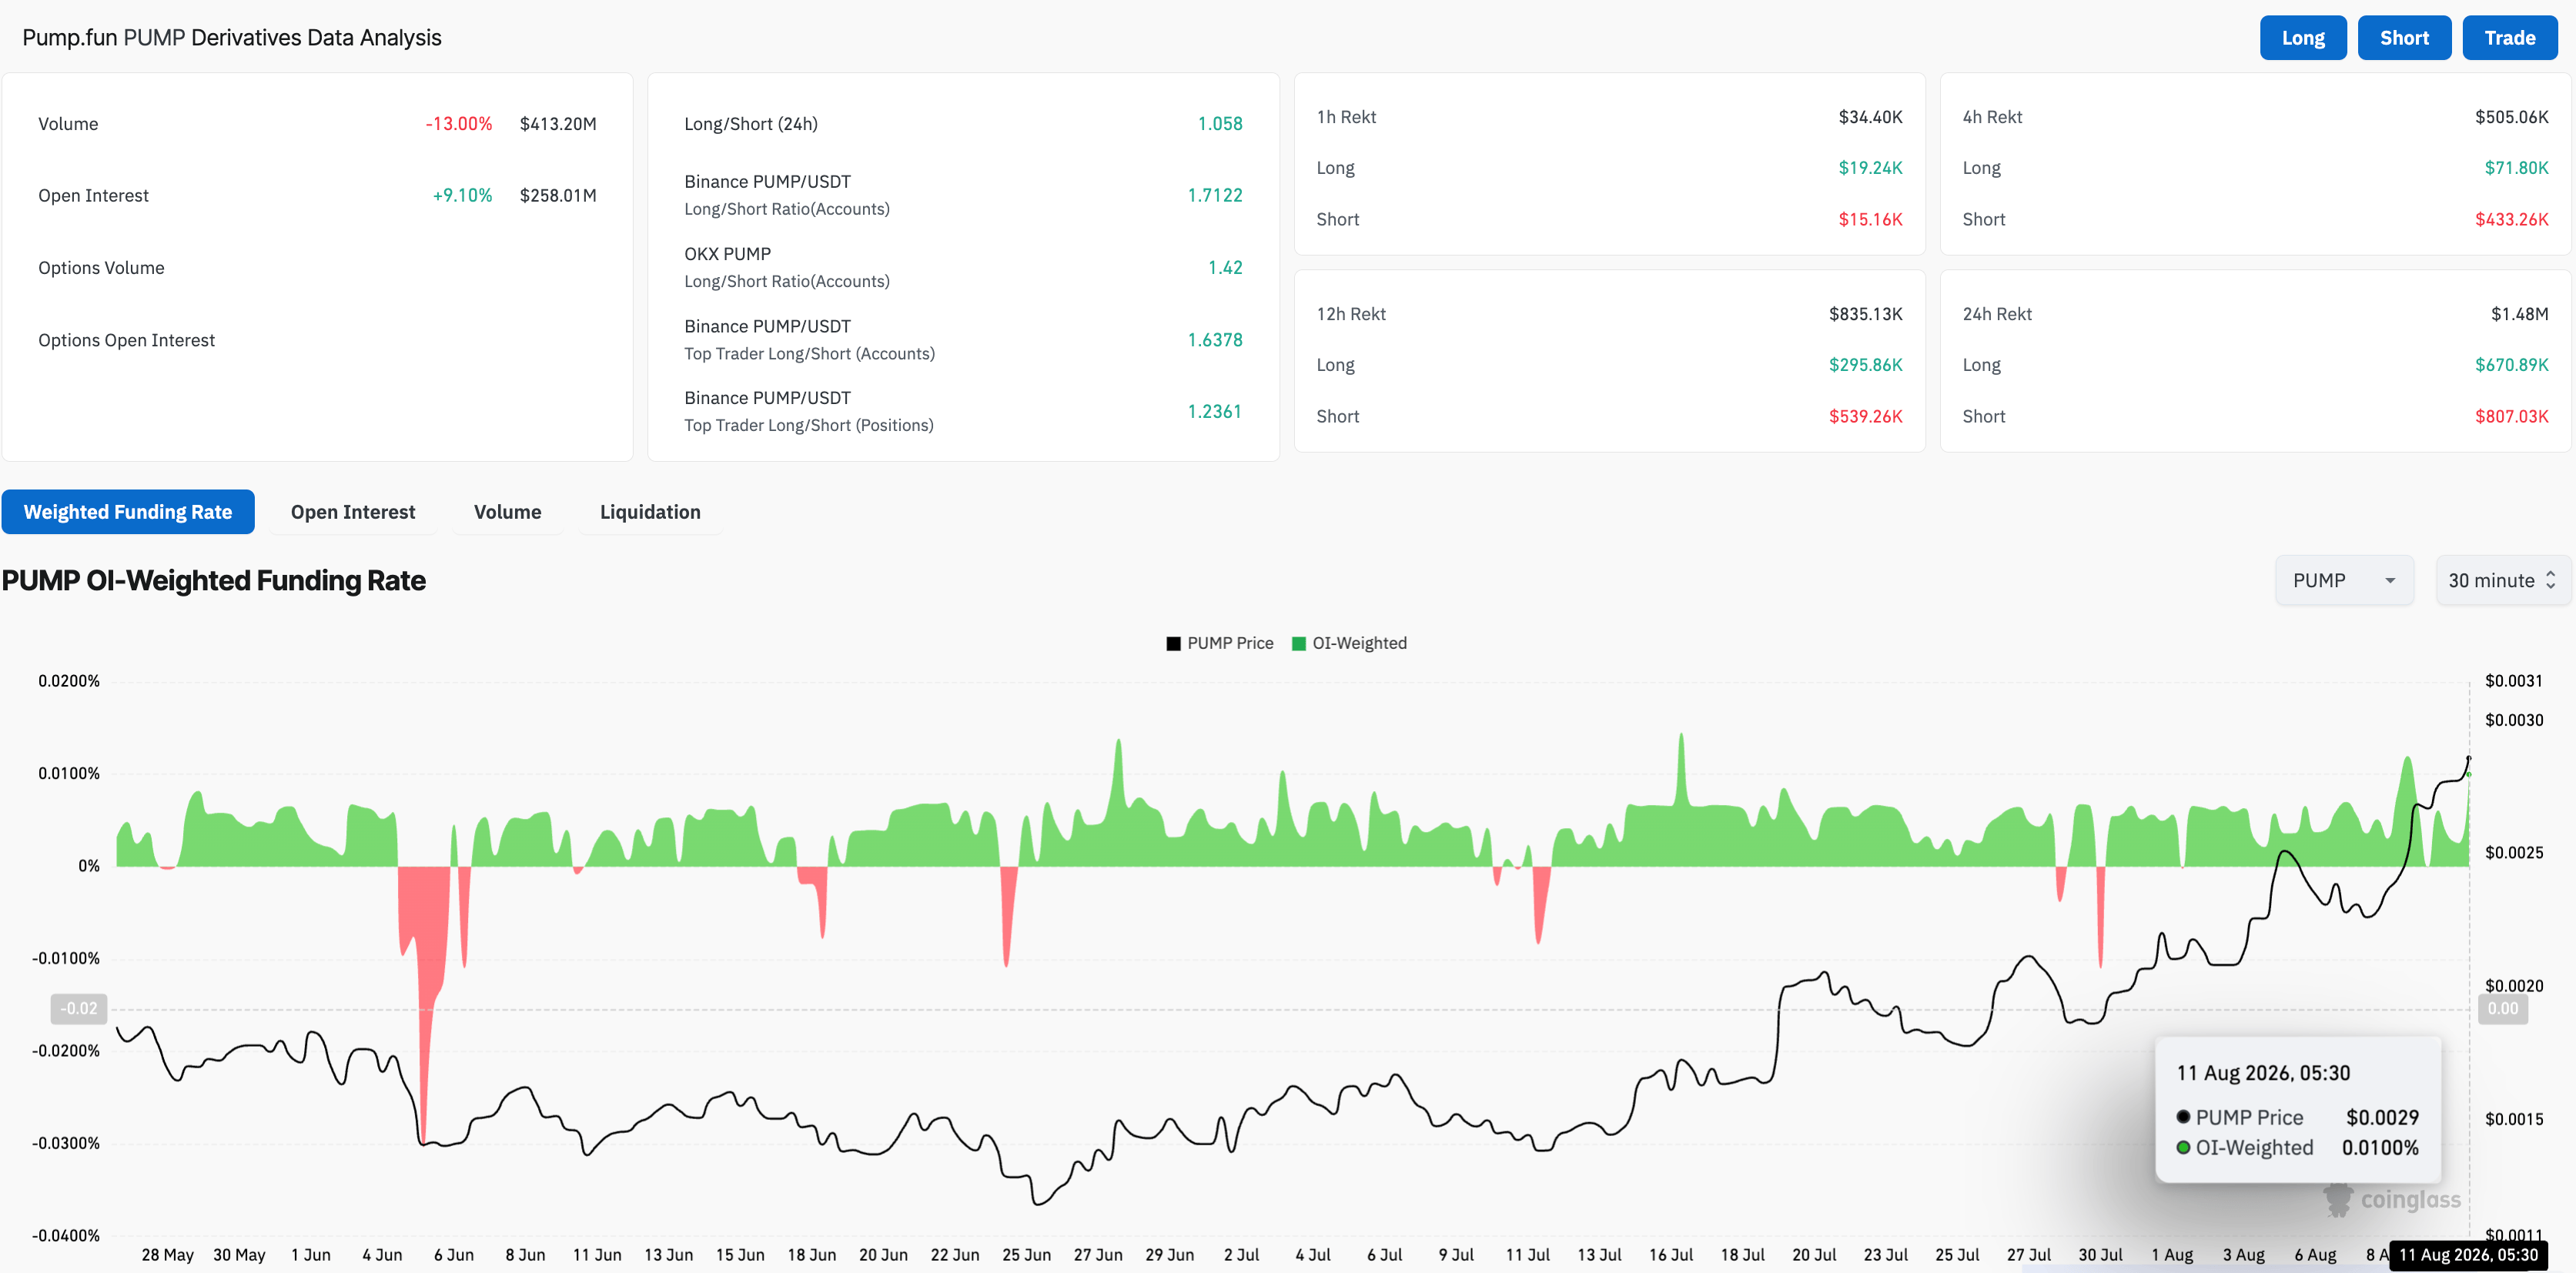
On the retail side, PUMP holds firm demand in the derivatives market. CoinGlass data shows that PUMP Open Interest (OI) is up 9% over the last 24 hours to $258.01 million, indicating an increase in the notional value of existing perpetual contracts. At the same time, a surge in the funding rate to 0.0100% reflects renewed interest among traders to buy long positions.
Technical outlook: Will PUMP extend gains above $0.0030?
PUMP trades around $0.0028 on Tuesday, extending its falling wedge pattern breakout. The breakout rally has hit a six-month high, inching closer to the $0.0030 round figure.
Momentum remains strong, with the Relative Strength Index (RSI) hovering in overbought territory near 75 and the Moving Average Convergence Divergence (MACD) line holding slightly above the signal line, hinting at persistent upside pressure but also the risk of a corrective pullback.
The path of least resistance for PUMP targets the $0.0030 round figure, followed by the December 3, 2025 high at $0.0033.
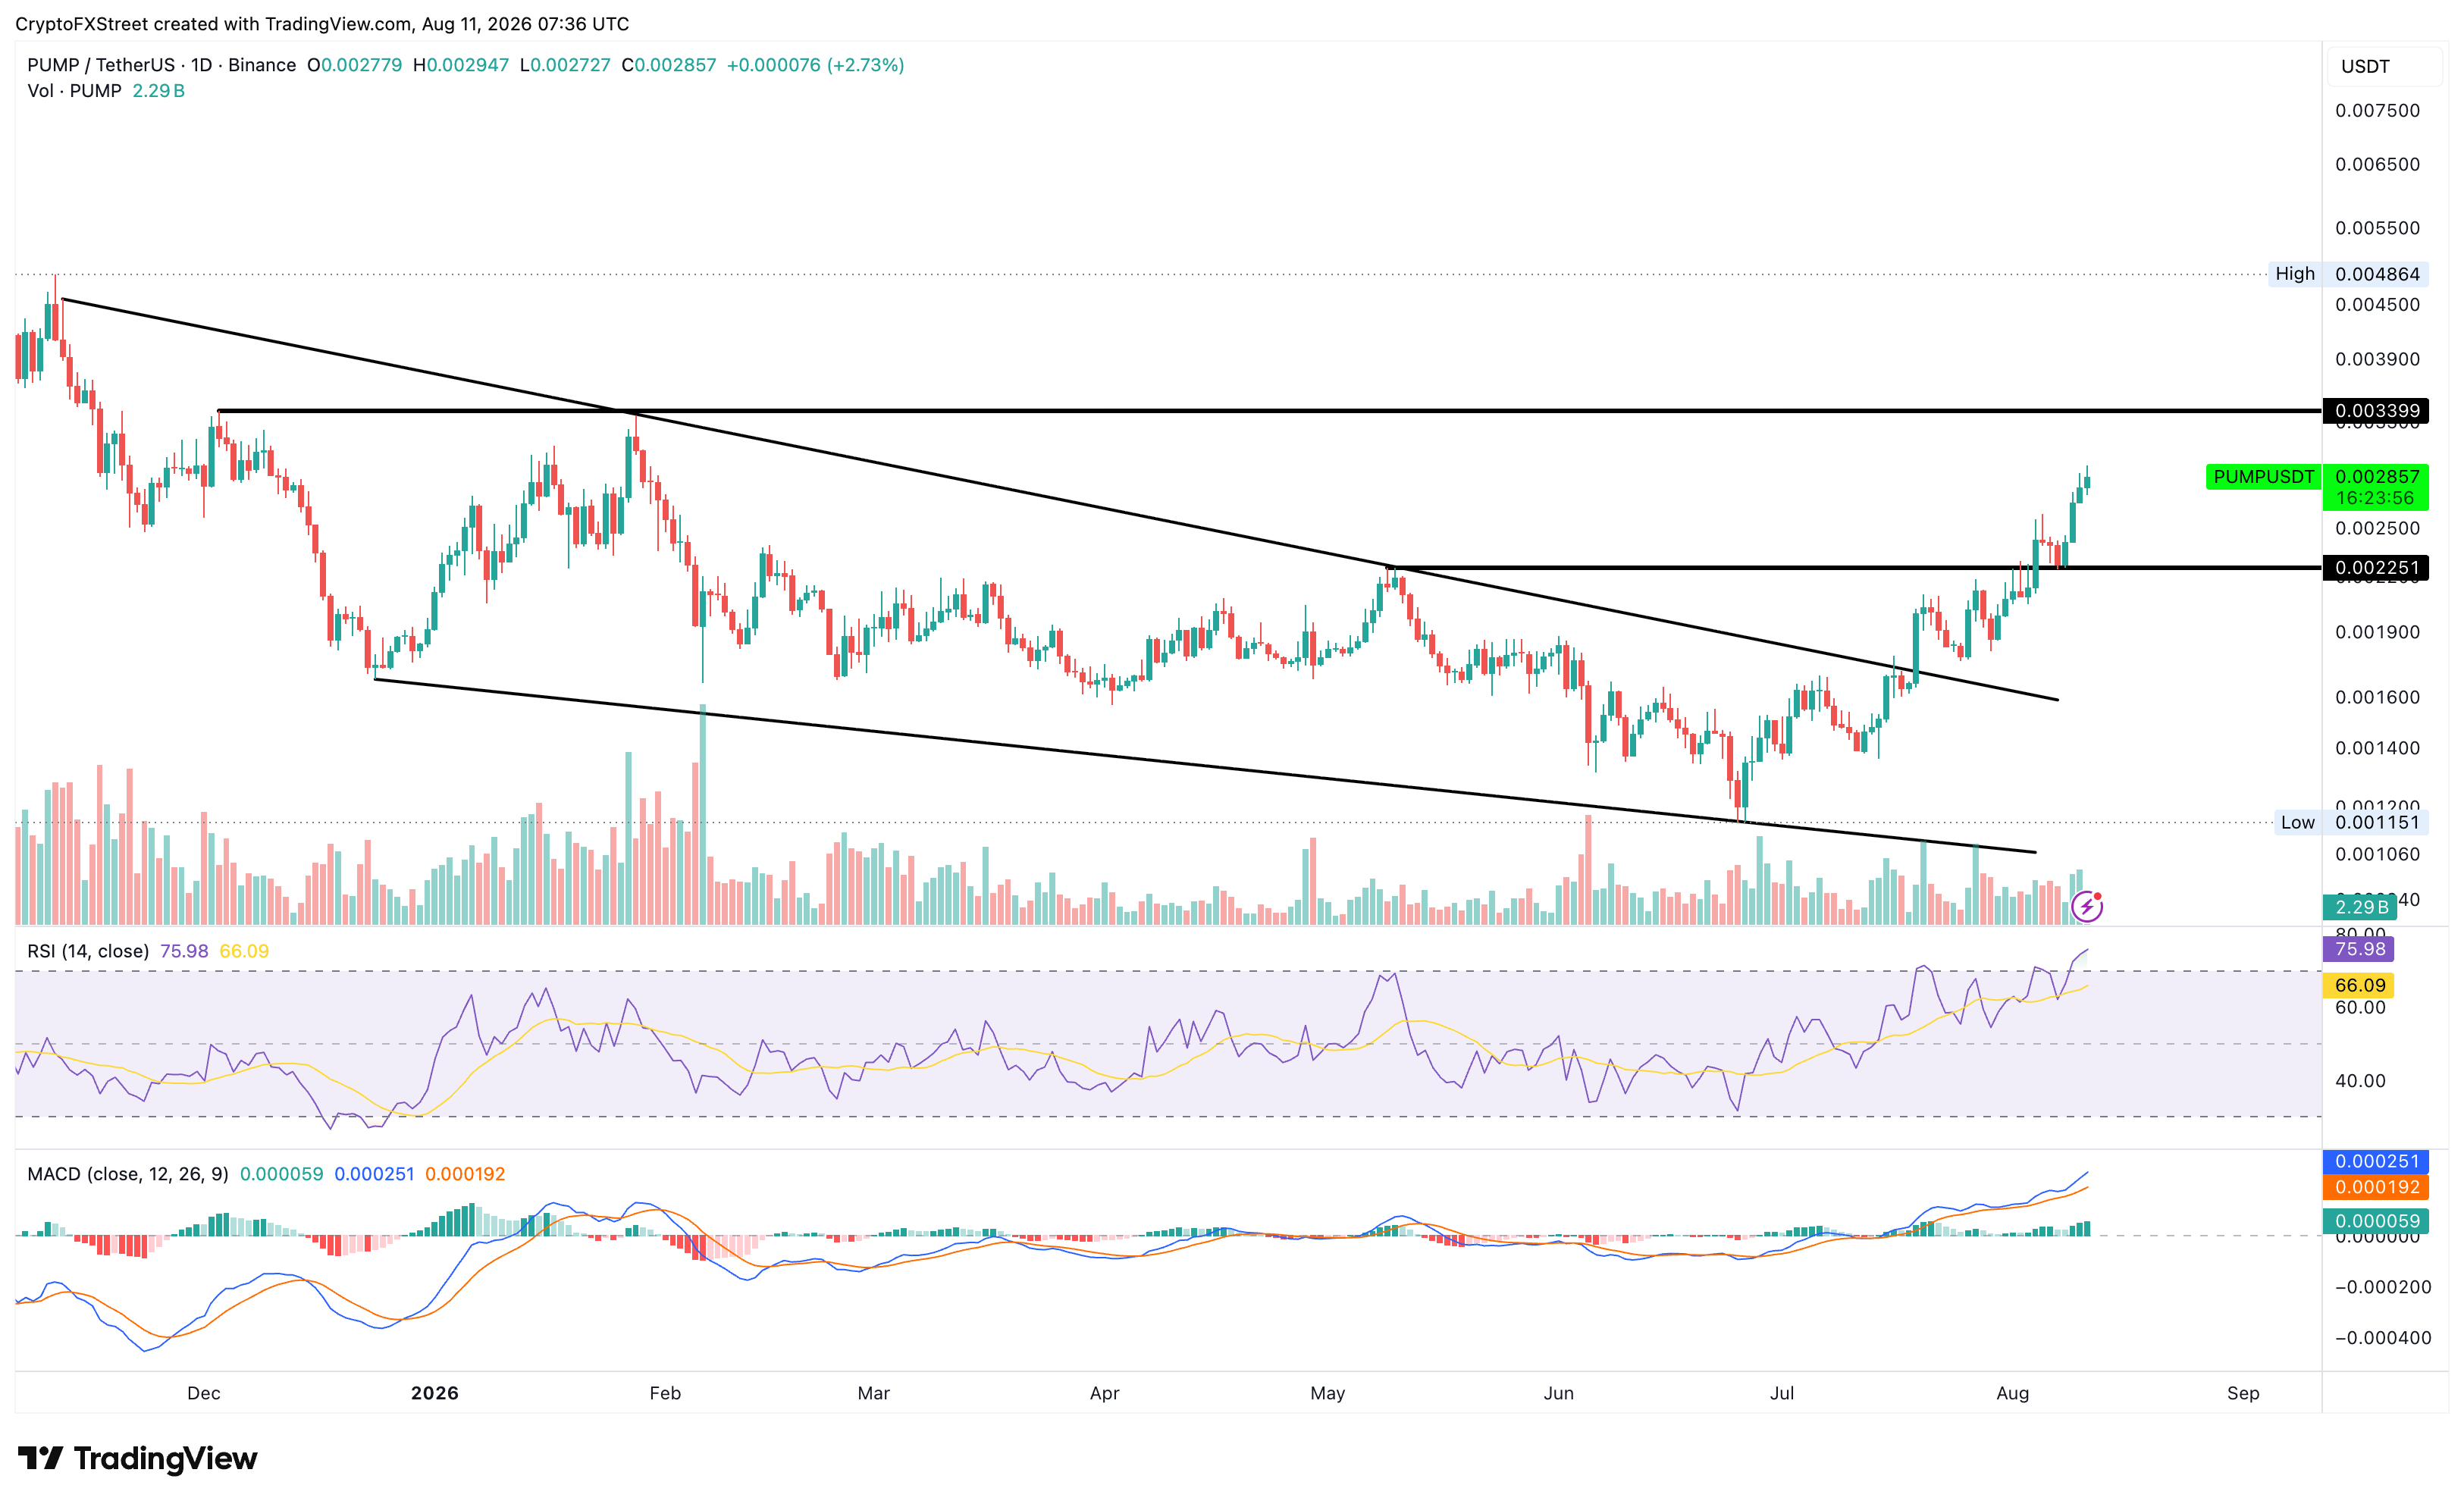
On the downside, immediate support is at the reclaimed May 9 high at $0.0022, providing the first key floor if profit-taking emerges. A deeper slide would expose the next structural cushion at the $0.0020 threshold, where buyers are likely to reassert control as long as this level holds.
(The technical analysis of this story was written with the help of an AI tool. Know more.)
Recommended Articles


