

Shiba Inu Price Forecast: SHIB risks over 10% drawdown amid declining burn rate

Source Fxstreet
  • Shiba Inu extends losses for a third consecutive day on Friday, testing the breakdown below the 50-day EMA at $0.00000466.
  • Over 6.62 million SHIB tokens were burned on Thursday, down from 97.16 million on Saturday, pointing to a declining burn rate.
  • Retail activity shows mixed sentiment, with funding rates fluctuating amid heightened liquidations of long positions.

Shiba Inu (SHIB) edges lower on Friday, facing downside pressure amid broader risk-off sentiment in the cryptocurrency market, including a delay in the CLARITY Act vote. The declining burn rate of SHIB tokens and retail support warn of deeper losses in the meme coin. The technical outlook for SHIB is bearish as the price tests the 50-day Exponential Moving Average (EMA) breakout level at $0.00000466.

Declining burn rate weighs on Shiba Inu

Shiba Inu burned over 97 million tokens on Saturday, aligning with the recent rebound earlier this week. However, a steady decline in SHIB token burn down to 6.62 million on Thursday reflects reducing supply pressure, which could weigh on the meme coin. 
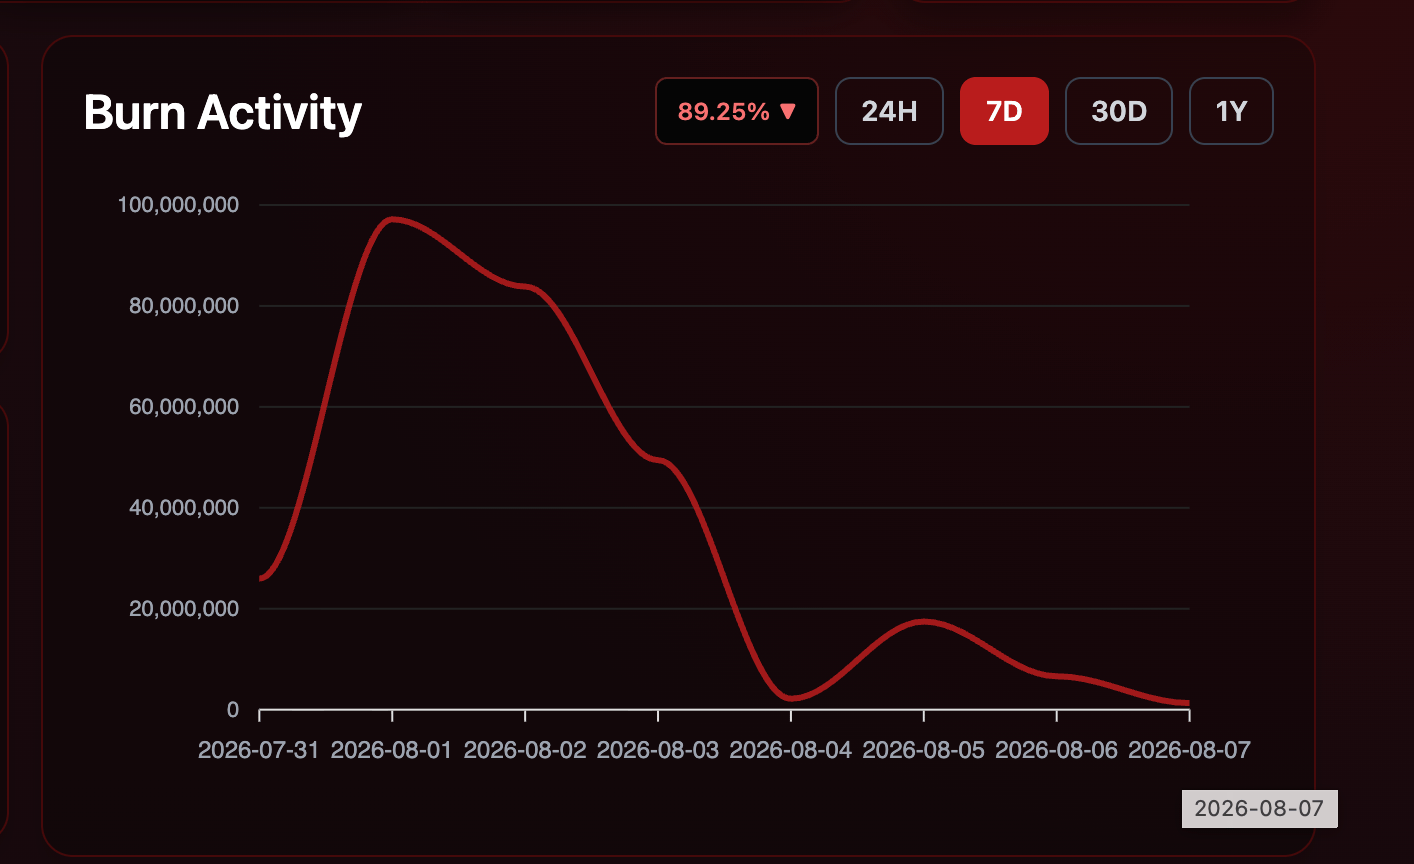
SHIB burning activity. Source: Shibburn

Retail support wanes amid delayed CLARITY Act vote

The delay in the CLARITY Act vote has reduced broader crypto risk appetite. Typically, meme coins are the first to flip bearish under broader market risk-averse conditions.

CoinGlass data shows that SHIB futures Open Interest (OI) has held firm near $43.53 million over the last 24 hours, while long liquidations of $172,390 have outpaced short liquidations of $17,670, reflecting bullish weakness. In addition, the funding rate bounced to 0.0059% on Friday, up from -0.0013% the previous day, reflecting fluctuating retail sentiment.
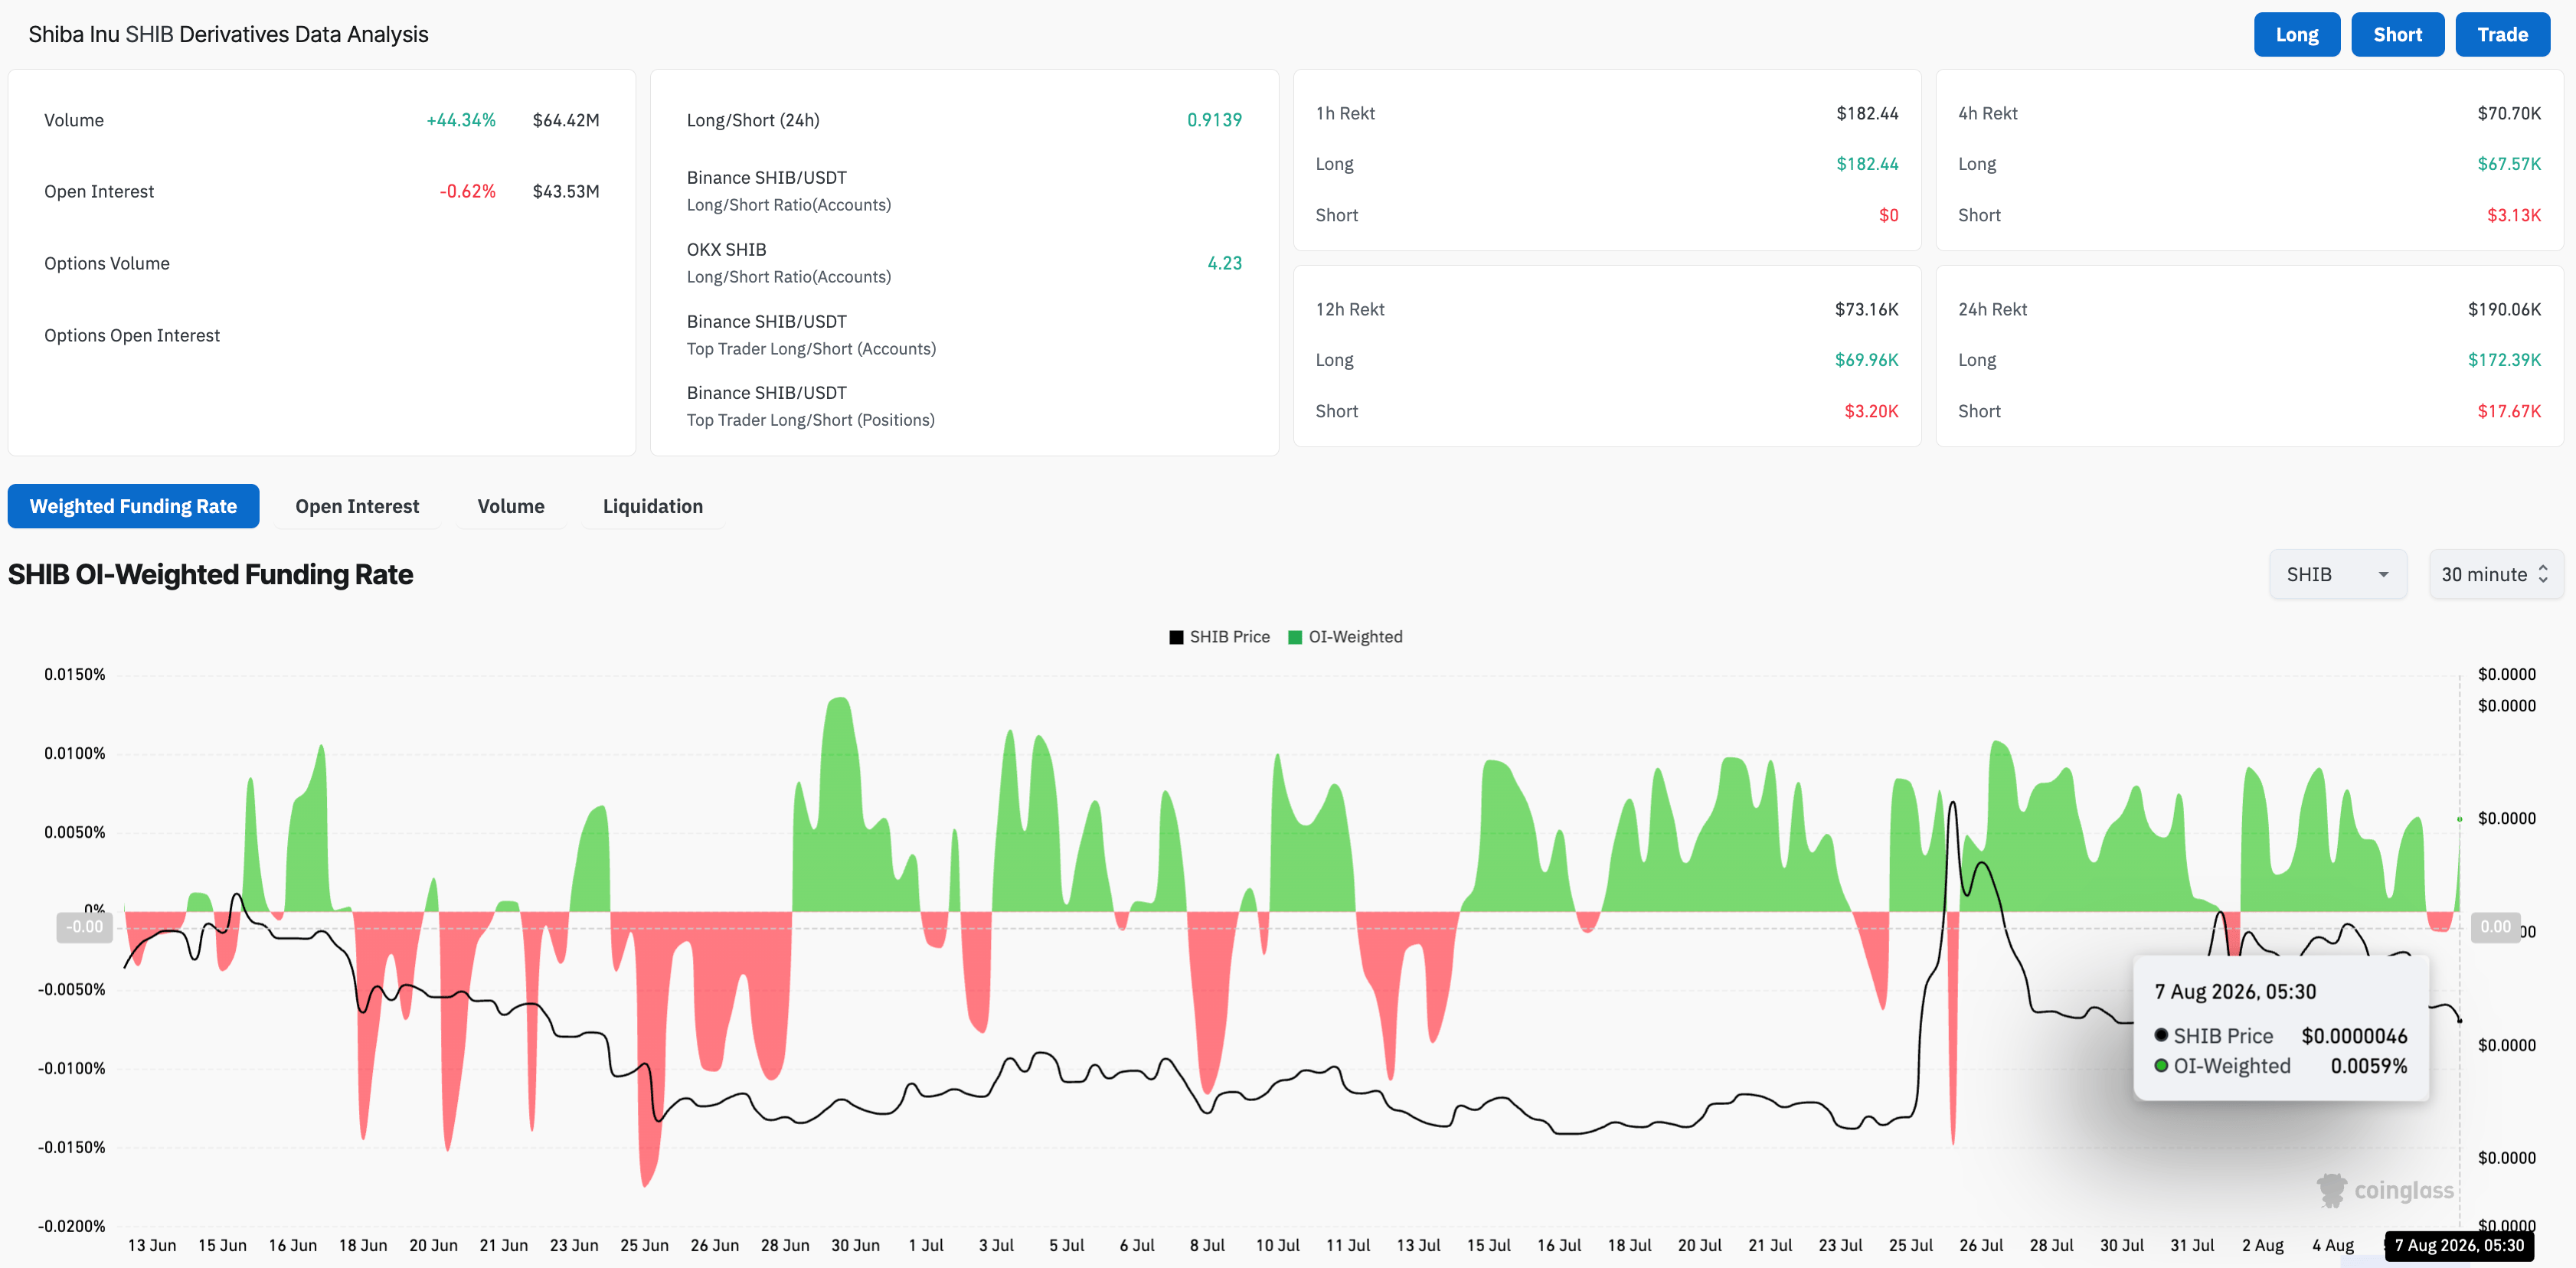
SHIB derivatives data. Source: CoinGlass

Technical outlook: Will SHIB extend its decline?

Shiba Inu extends losses on Friday, after a nearly 5% loss the previous day. The pullback tests the bearish breakout of the 50-day EMA at $0.0000046.

From a technical perspective, the short-term moving average is supported by the 78.6% Fibonacci retracement level, measured from the $0.00000670 high to the $0.00000405 low, at $0.00000462. A decisive close below this support cluster could extend the decline toward the Fibonacci anchor at $0.00000405, marking more than 10% downside risk from the current market price.

The Relative Strength Index (RSI) is at 49 on the daily chart, crossing below the midline as buying pressure wanes.
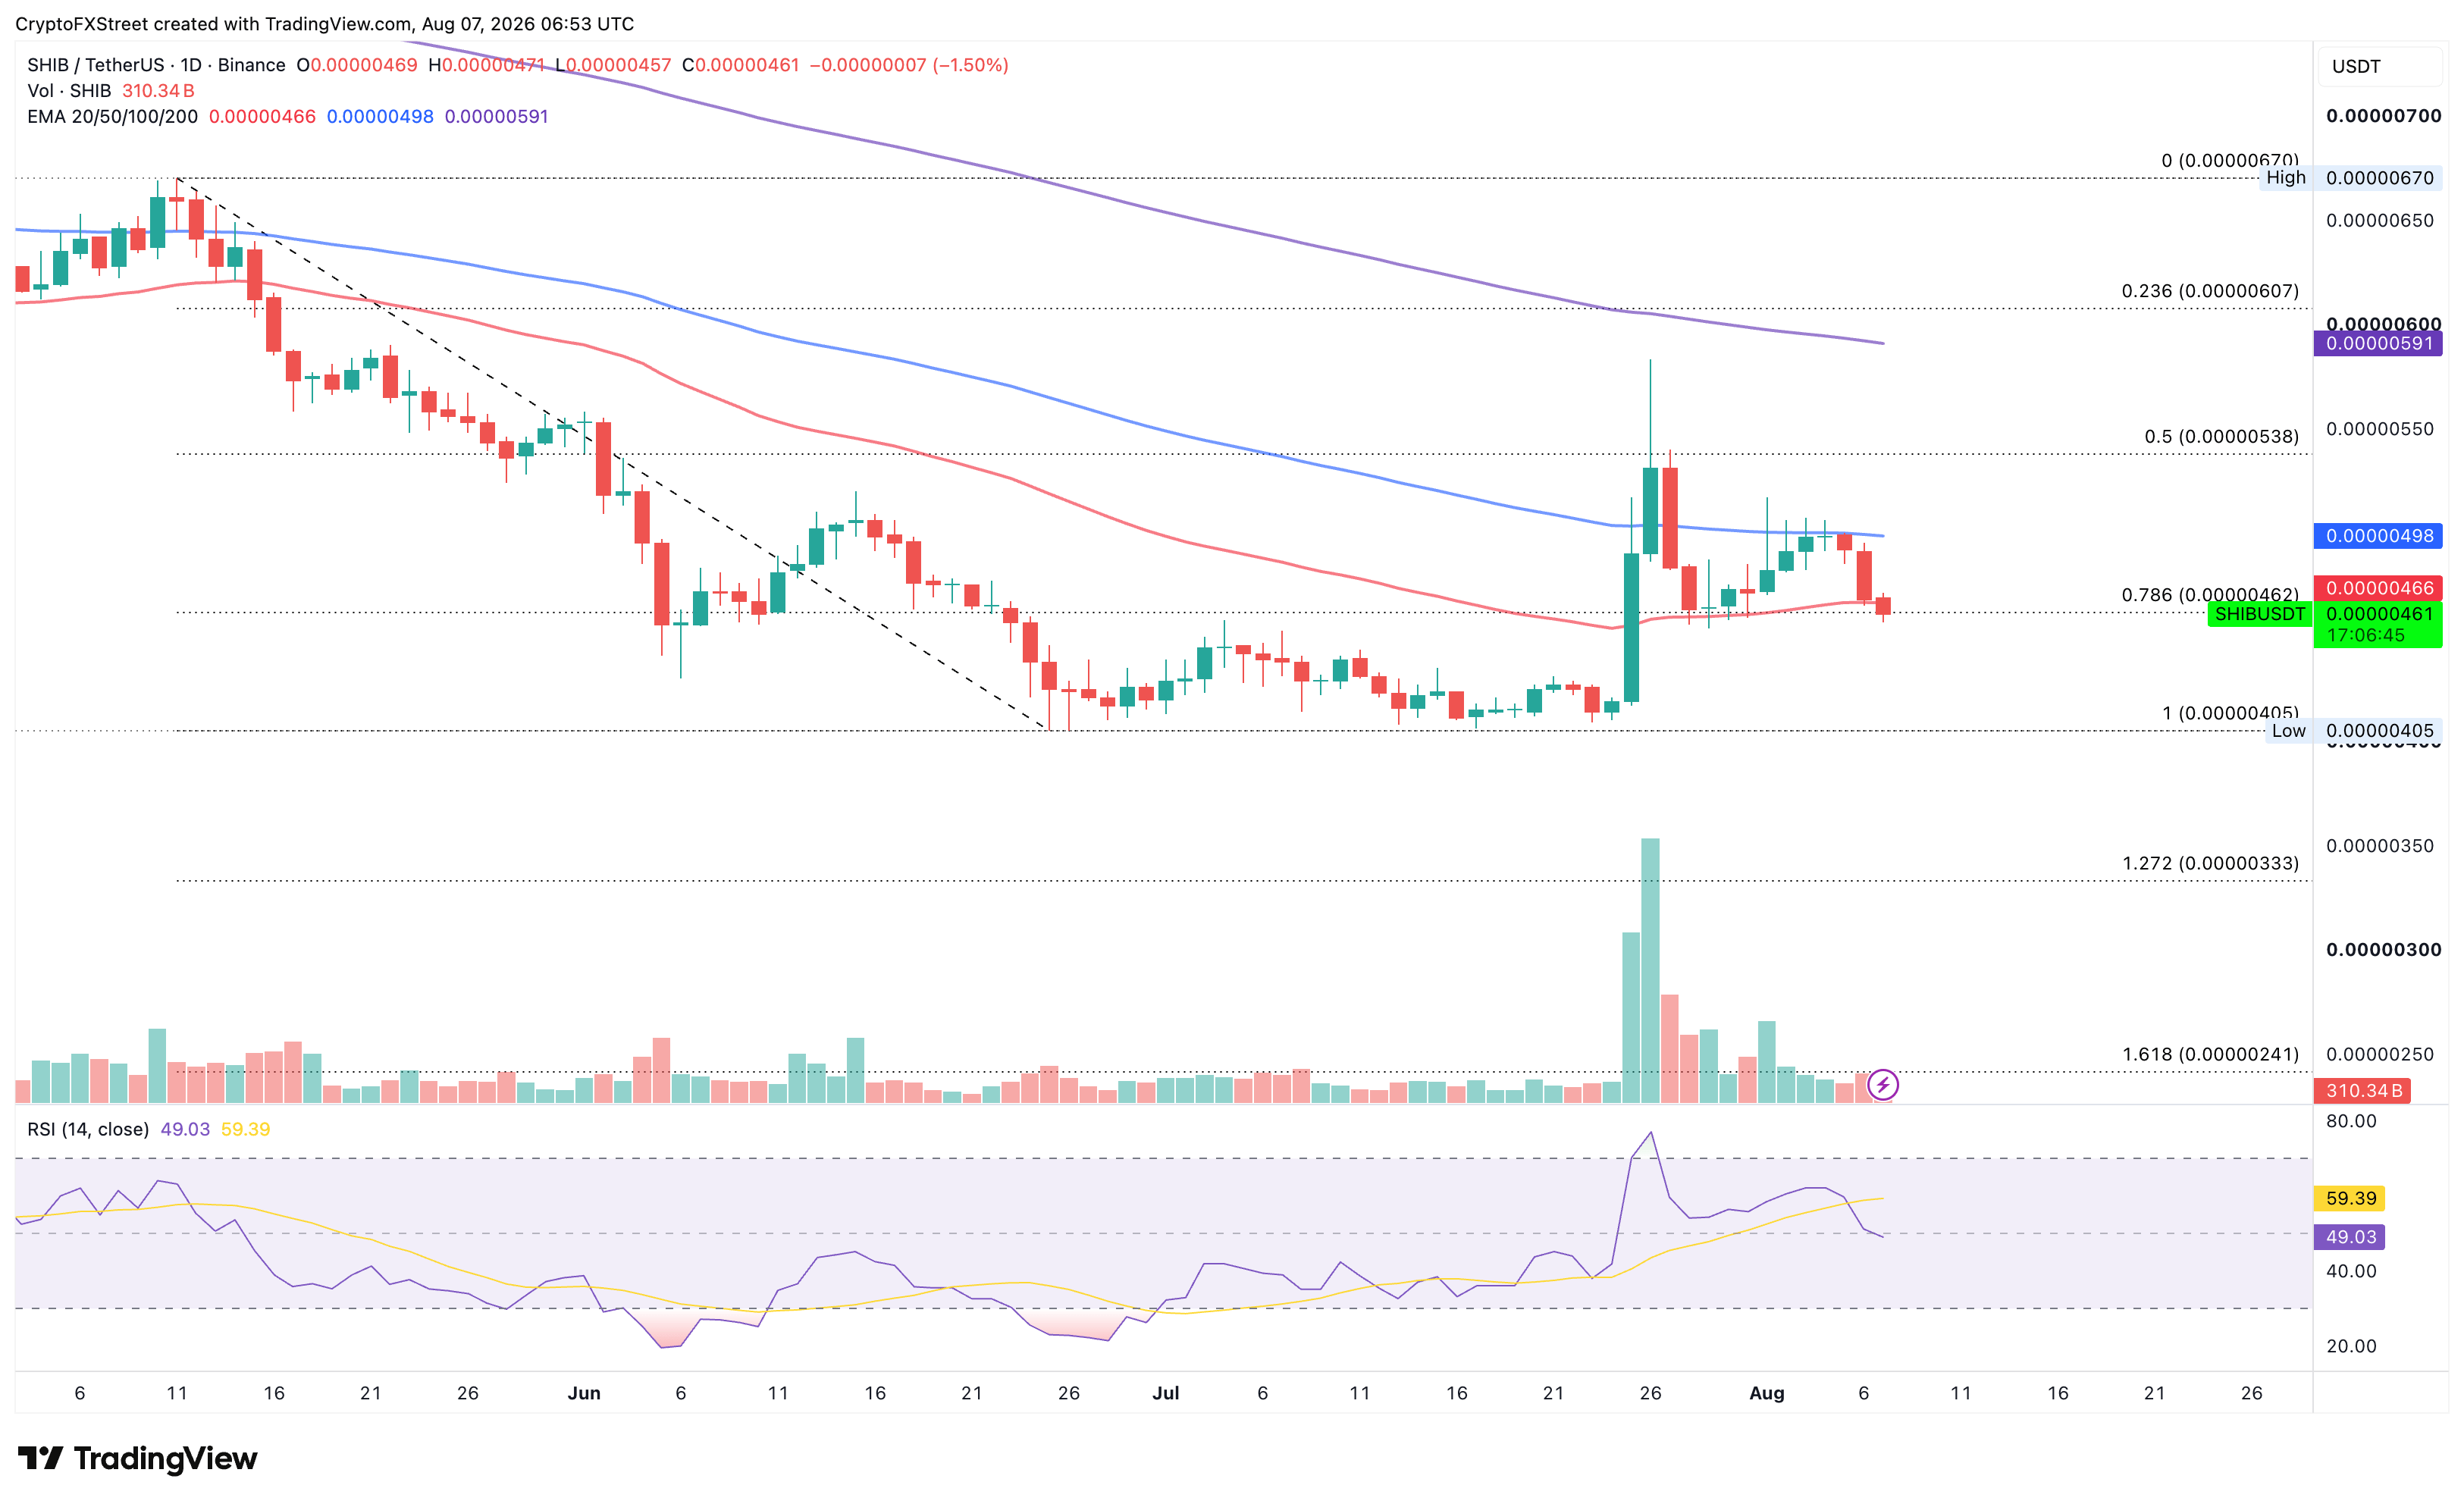
SHIB/USDT daily price chart.

On the top side, a potential rebound from the 50-day EMA at $0.0000046 could target the 100-day EMA at $0.00000498, followed by the 50% retracement at $0.00000538.

(The technical analysis of this story was written with the help of an AI tool. Know more.)

Disclaimer: For information purposes only. Past performance is not indicative of future results.
placeholder
Japan, South Korea Stocks Rise in Early Trade; Samsung, SK Hynix Soar, SoftBank, Kioxia Track GainsTradingKey - Both the KOSPI and Nikkei 225 indexes opened higher, led by gains in Samsung Electronics and SK Hynix, with SoftBank and Kioxia following suit.During the Asian session on June 30, both Ja
Author  TradingKey
Jun 30, Tue
TradingKey - Both the KOSPI and Nikkei 225 indexes opened higher, led by gains in Samsung Electronics and SK Hynix, with SoftBank and Kioxia following suit.During the Asian session on June 30, both Ja
placeholder
XRP Price Prediction for July 2026: Can Buyers Finally Break the Downtrend?XRP (XRP) price trades near $1.05, caught between a year-long downtrend and a sudden burst of buying.July has historically rewarded XRP holders. This year the month arrives with on-chain accumulation
Author  Beincrypto
Jun 30, Tue
XRP (XRP) price trades near $1.05, caught between a year-long downtrend and a sudden burst of buying.July has historically rewarded XRP holders. This year the month arrives with on-chain accumulation
placeholder
Intel Price Forecast: Nvidia Picked Xeon 6, Invested $5B, Yet Analysts Still Trail INTCIntel Corporation (NASDAQ: INTC) sits at $140.05, holding firm on the ascending trendline within the 2H timeframe. The RSI indicator is currently reading 55.21, positioning it as neutral-
Author  TradingKey
Jul 02, Thu
Intel Corporation (NASDAQ: INTC) sits at $140.05, holding firm on the ascending trendline within the 2H timeframe. The RSI indicator is currently reading 55.21, positioning it as neutral-
placeholder
NVIDIA Price Forecast: Michael Burry Shorts NVDA, but Analysts See $299On July 1, NVIDIA (NASDAQ: NVDA) sits at $198.34, failing to break above the former support level that is now serving as resistance between $198 and $205 on the 2H chart's downward blue c
Author  TradingKey
Jul 02, Thu
On July 1, NVIDIA (NASDAQ: NVDA) sits at $198.34, failing to break above the former support level that is now serving as resistance between $198 and $205 on the 2H chart's downward blue c
placeholder
Brent Crude Oil Erases Entire War Premium, Falls 40% to Pre-War LevelsBrent crude oil has erased its entire war premium, sliding roughly 40% from its March peak near $120 to trade around $72.25 on Wednesday. The move returns oil to its pre-war support base.The retreat f
Author  Beincrypto
Jul 02, Thu
Brent crude oil has erased its entire war premium, sliding roughly 40% from its March peak near $120 to trade around $72.25 on Wednesday. The move returns oil to its pre-war support base.The retreat f
goTop
quote