

Pi Network Price Forecast: PI eyes bullish breakout amid RoboPay payment partnership

Source Fxstreet
  • Pi Network edges higher on Wednesday, hinting at a bullish breakout of the near-term resistance trendline.
  • Pi Network joins RoboPay as a payment partner, suggesting growing adoption.
  • The technical outlook for PI shows a mild bullish bias as upside momentum recovers.

Pi Network (PI) edges higher on Wednesday, testing the breakout of a near-term triangle pattern. The recent payment partnership with Robopay signals growing adoption on Pi Network. The technical outlook for PI indicates a mild bullish bias with selling pressure waning.

Demand holds firm amid new partnership

Fabric Foundation announced in a social media post on Wednesday that Pi Network has joined RoboPay as a payment partner. The integration will enable Pi users to pay for robot services such as deliveries, security patrols, inspections, and humanoid in PI tokens.

In addition, speculative demand for Pi Network holds firm so far this week. CoinAnk data show that the PI futures Open Interest (OI) is $8.82 million on Wednesday, up from $8.51 million the previous day, indicating an increase in the notional value of active perpetual contracts, likely driven by positional buildup.

PI token Open Interest chart. Source: CoinAnk

Technical outlook: Will PI regain bullish momentum?

Pi Network extends its mild recovery on Wednesday, testing the resistance trendline of a short-term triangle pattern near $0.0850, formed within a larger falling channel pattern. PI remains capped below a broader downtrend trendline near $0.0900.

The Moving Average Convergence Divergence (MACD) shows a modest upward trend with its signal line, suggesting some nascent upside momentum. At the same time, the Relative Strength Index (RSI) at 44 shows mild recovery just below the midline, indicating easing downside pressure.

To reinstate an upward trend, the PI must surpass the overhead trendlines cluster near $0.0900, followed by the 127.2% Fibonacci extension level, measured from the $0.1998 high to the $0.1183 low, at $0.0961.
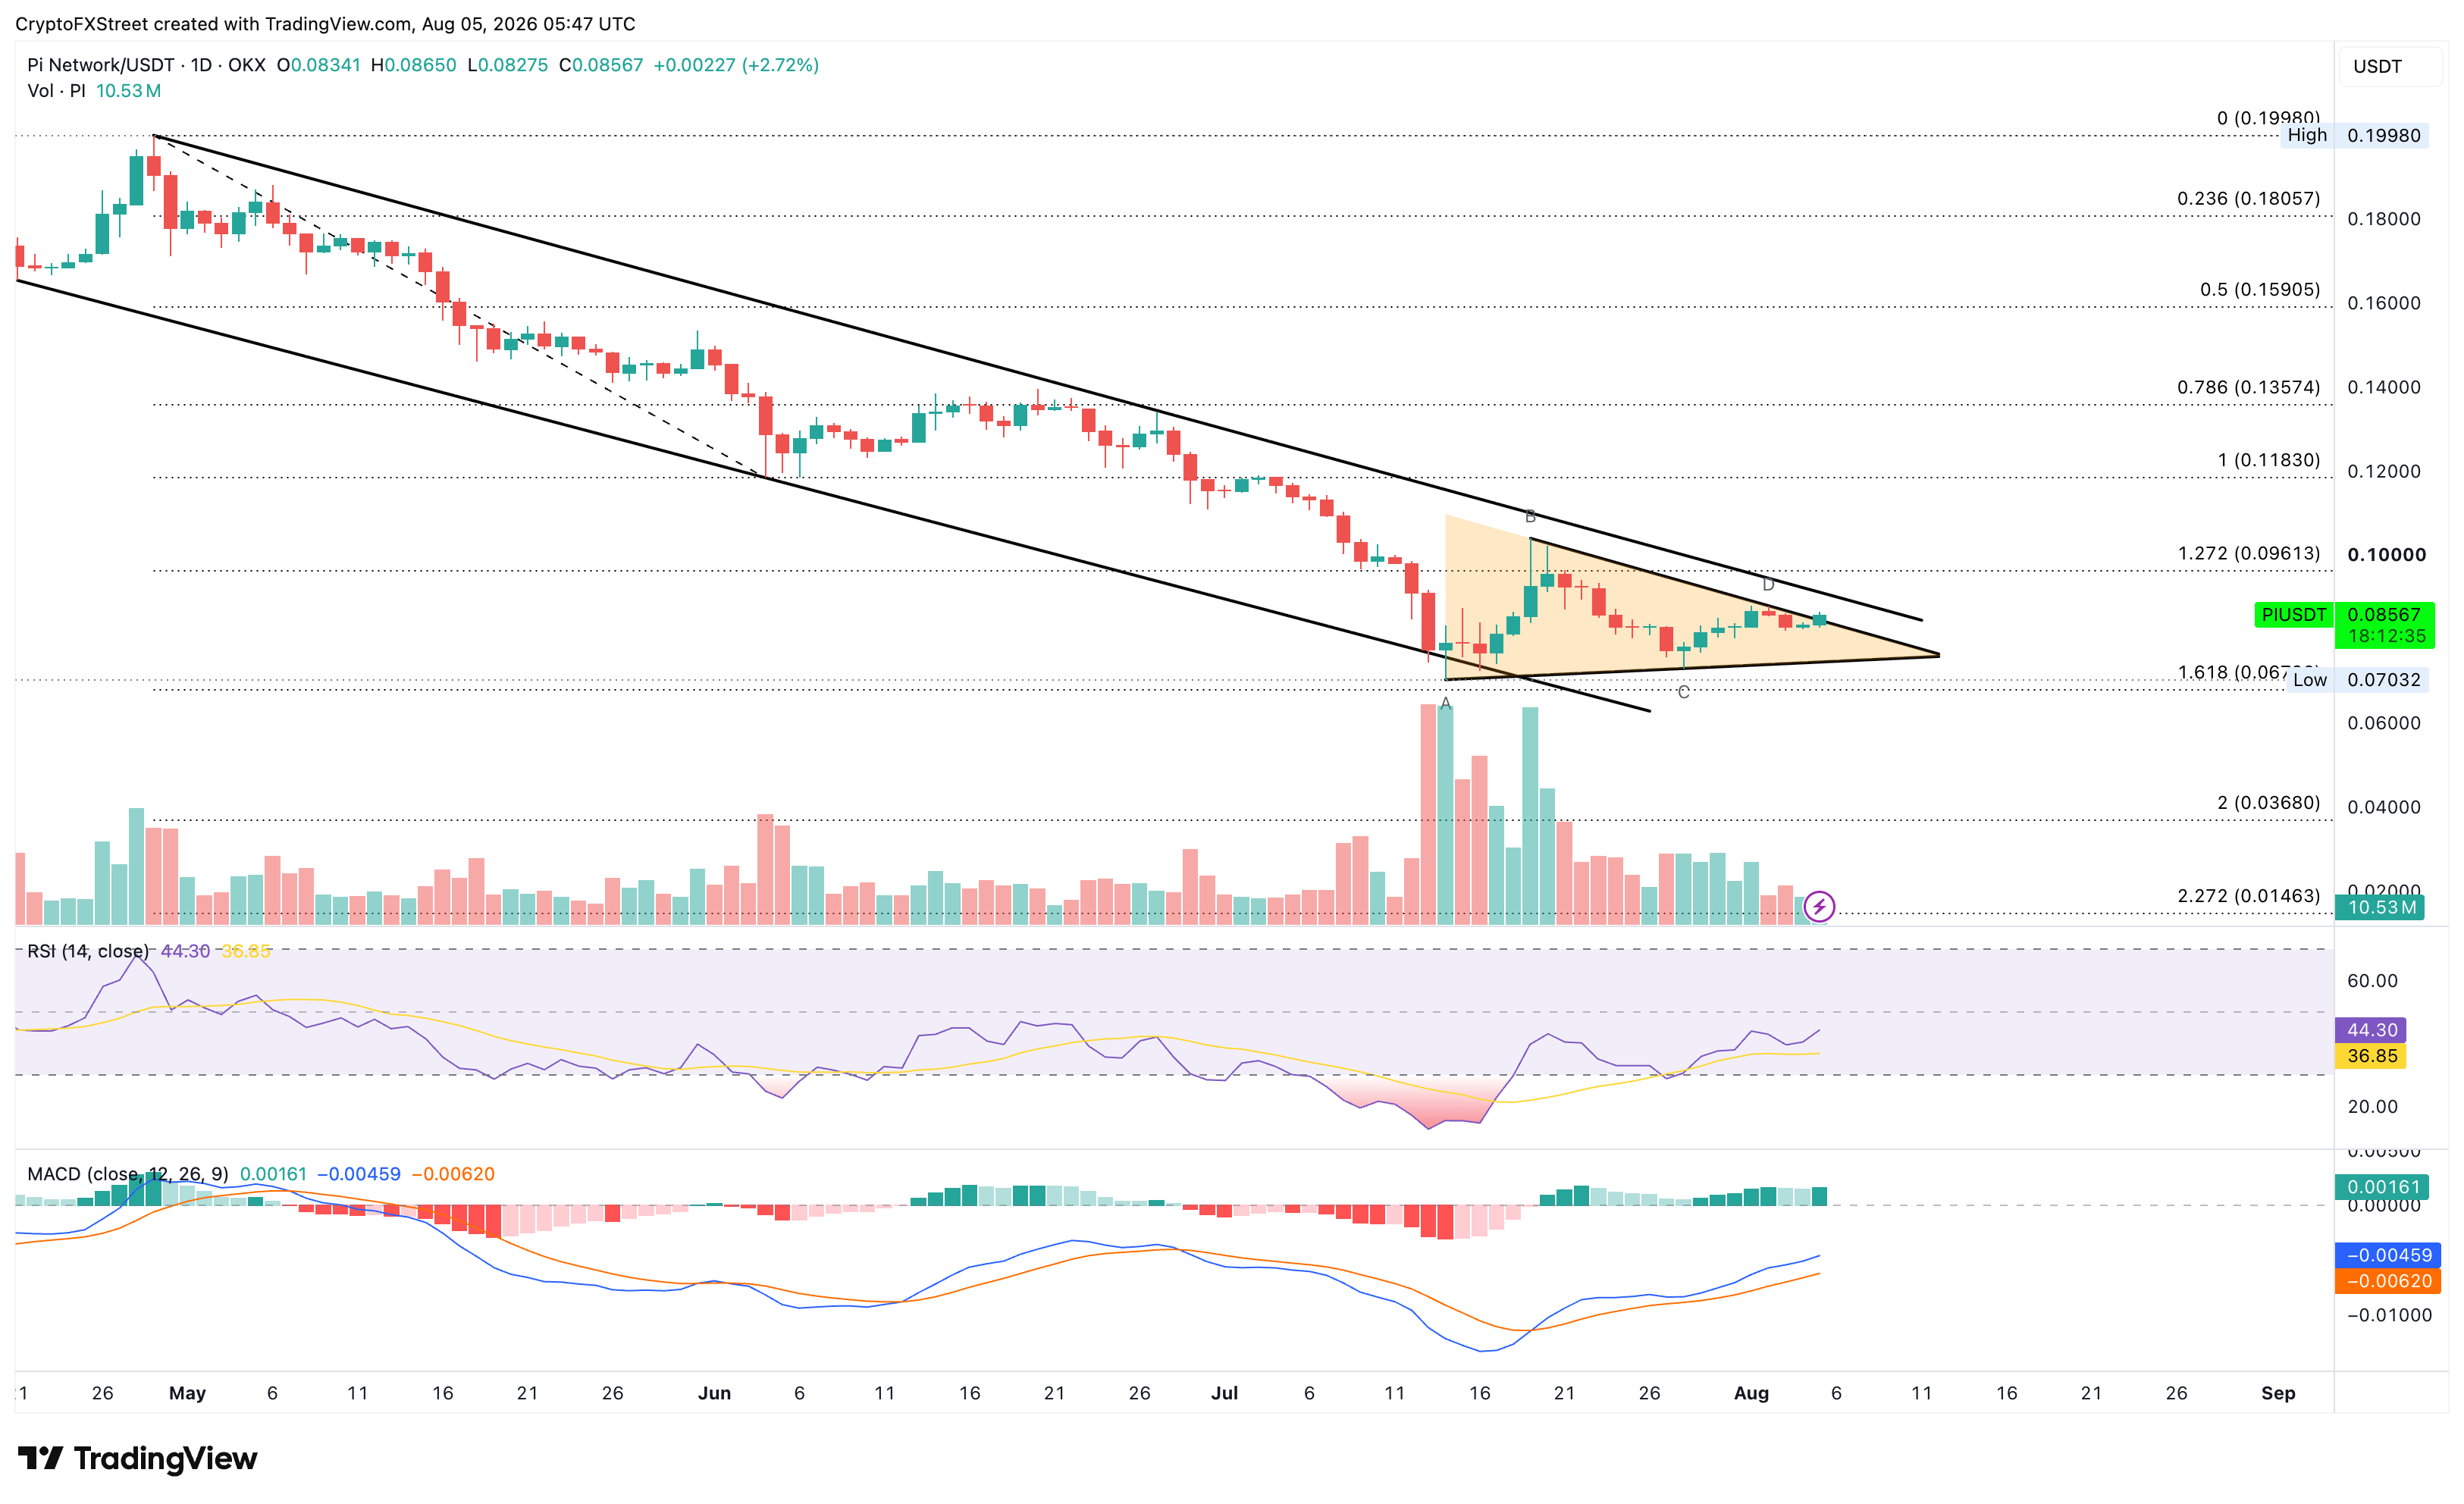
PI/USD daily price chart.

Looking down, the crucial support for PI aligns with the record low of $0.0700 and is reinforced by the 161.8% Fibonacci extension level at $0.0679.

(The technical analysis of this story was written with the help of an AI tool. Know more.)

Disclaimer: For information purposes only. Past performance is not indicative of future results.
placeholder
Will the Tech Rally Continue? The Technical Verdict on the NASDAQ 100 Riding a massive 32% post-earnings wave, the Nasdaq-100 is showing its first signs of exhaustion. We break down crucial exit and entry rules for long positions this week.
Author  Mitrade Team
6 Month 05 Day Fri
Riding a massive 32% post-earnings wave, the Nasdaq-100 is showing its first signs of exhaustion. We break down crucial exit and entry rules for long positions this week.
placeholder
XRP Price Prediction for July 2026: Can Buyers Finally Break the Downtrend?XRP (XRP) price trades near $1.05, caught between a year-long downtrend and a sudden burst of buying.July has historically rewarded XRP holders. This year the month arrives with on-chain accumulation
Author  Beincrypto
6 Month 30 Day Tue
XRP (XRP) price trades near $1.05, caught between a year-long downtrend and a sudden burst of buying.July has historically rewarded XRP holders. This year the month arrives with on-chain accumulation
placeholder
Intel Price Forecast: Nvidia Picked Xeon 6, Invested $5B, Yet Analysts Still Trail INTCIntel Corporation (NASDAQ: INTC) sits at $140.05, holding firm on the ascending trendline within the 2H timeframe. The RSI indicator is currently reading 55.21, positioning it as neutral-
Author  TradingKey
7 Month 02 Day Thu
Intel Corporation (NASDAQ: INTC) sits at $140.05, holding firm on the ascending trendline within the 2H timeframe. The RSI indicator is currently reading 55.21, positioning it as neutral-
placeholder
NVIDIA Price Forecast: Michael Burry Shorts NVDA, but Analysts See $299On July 1, NVIDIA (NASDAQ: NVDA) sits at $198.34, failing to break above the former support level that is now serving as resistance between $198 and $205 on the 2H chart's downward blue c
Author  TradingKey
7 Month 02 Day Thu
On July 1, NVIDIA (NASDAQ: NVDA) sits at $198.34, failing to break above the former support level that is now serving as resistance between $198 and $205 on the 2H chart's downward blue c
placeholder
Brent Crude Oil Erases Entire War Premium, Falls 40% to Pre-War LevelsBrent crude oil has erased its entire war premium, sliding roughly 40% from its March peak near $120 to trade around $72.25 on Wednesday. The move returns oil to its pre-war support base.The retreat f
Author  Beincrypto
7 Month 02 Day Thu
Brent crude oil has erased its entire war premium, sliding roughly 40% from its March peak near $120 to trade around $72.25 on Wednesday. The move returns oil to its pre-war support base.The retreat f
goTop
quote