


Cardano Price Forecast: ADA capped at $0.20 warns of over 15% downside
- Cardano edges lower on Wednesday after the prevailing recovery of over 25% was capped at $0.2000 the previous day.
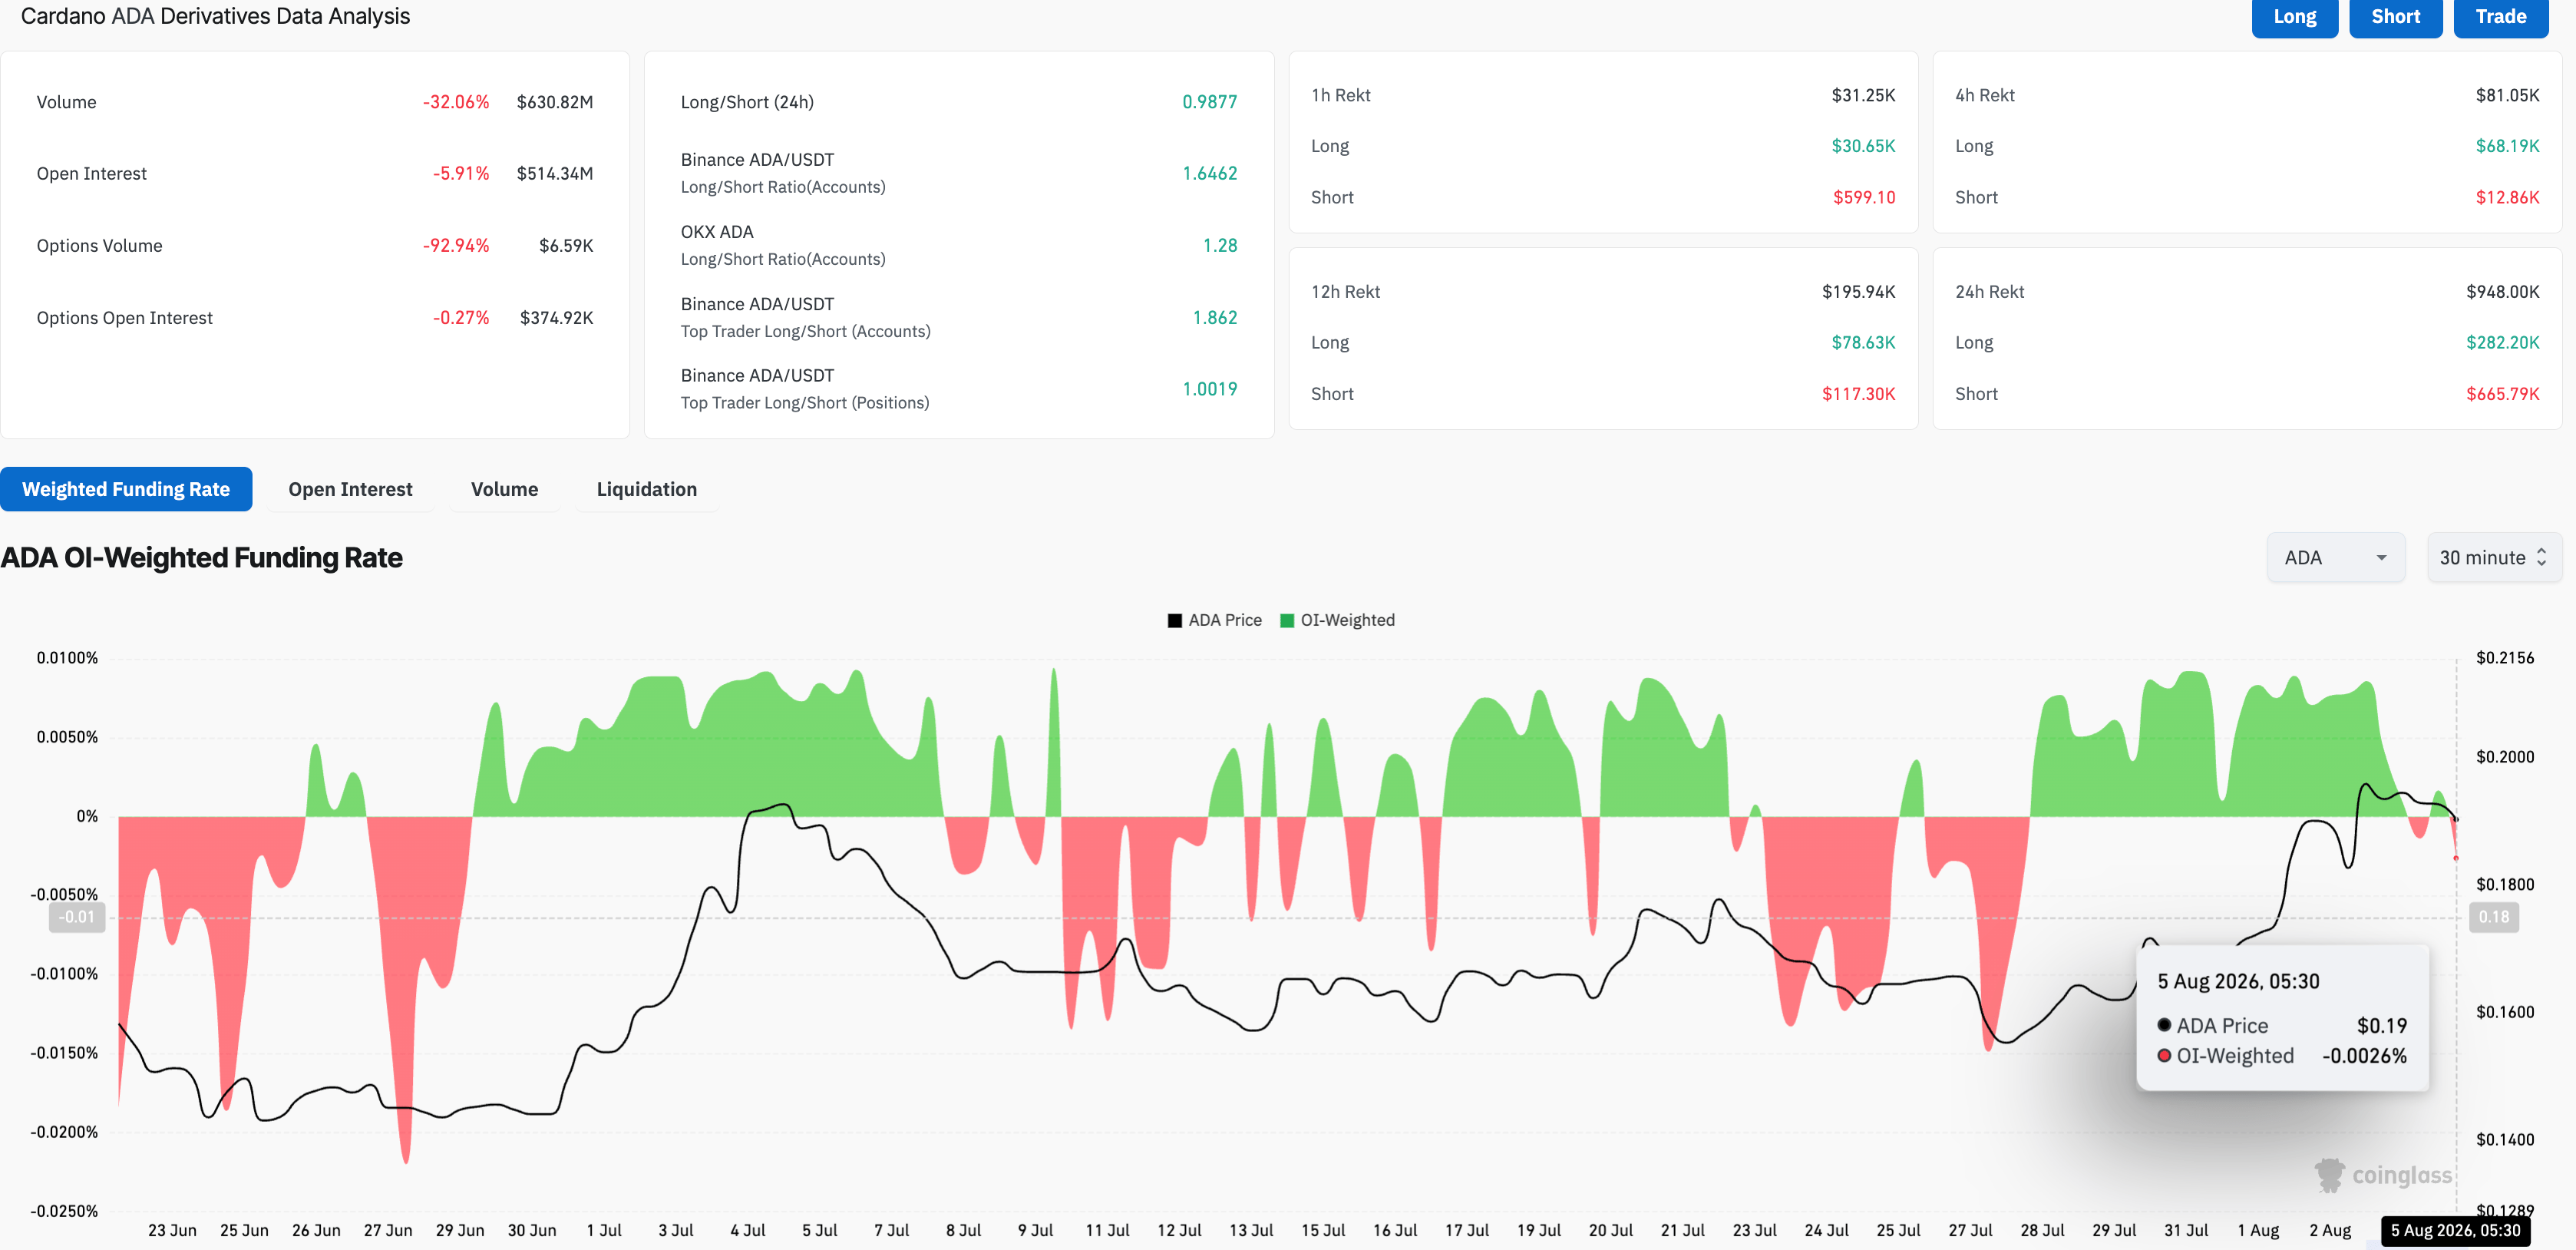
- Declining Open Interest and a negative funding rate hint at waning retail support.
- The technical outlook for Cardano warns of a pullback, with the $0.2000 resistance level remaining intact.
Cardano (ADA) price is trading in the red on Wednesday, reversing after the recent 25% recovery was capped at $0.2000 the previous day. Speculative demand in ADA futures is easing, with Open Interest and funding rates declining. The technical outlook is mildly bearish, hinting at a pullback toward the 50-day Exponential Moving Average (EMA) at $0.1761.
Cardano loses the spark in retail support
Cardano surged 14% last week, fueling near-term retail demand. Cardano’s Inter-Blockchain Communication (IBC) connection with Injective (INJ) went live on Monday, marking the end of “buy the news, sell the event.” At the same time, the short-term recovery peaked at $0.2000 on Tuesday, a key psychological threshold that has been intact since July 4.
With the ADA recovery capped, the renewed retail demand shows signs of easing. CoinGlass data shows that ADA futures Open Interest (OI) is down roughly 6% over the last 24 hours to $514.34 million, indicating a reduced notional value of active perpetual contracts. In addition, the OI-weighted funding rate has fallen below zero to -0.0026%, suggesting traders are willing to take short positions.
Technical outlook: Will ADA price drop below its 50-day EMA?
Cardano edges lower toward $0.1900 at press time on Wednesday, extending losses after forming a Gravestone Doji candle near $0.2000 the previous day. Still, ADA maintains a constructive near-term bullish bias as price holds above the 50-day EMA at $0.1761, while still trading well beneath the 200-day EMA at $0.2598, which caps the broader trend.
From a technical perspective, the capped recovery at $0.2000 warns of a steeper correction toward the 50-day EMA at $0.1761. A sustained close below this level could extend the decline toward the June 25 low at $0.1382, representing roughly an 18% downside risk from the current market price.
The Relative Strength Index (RSI) at roughly 64 reverses from the overbought boundary but remains in bullish territory, while the Moving Average Convergence Divergence (MACD) and signal line hold an upward trend above the zero line, suggesting upside momentum is still in play.
To sustain an upward trend, ADA must clear the $0.2000 threshold, which could pave the way toward the 200-day EMA at $0.2598, the next meaningful resistance.
(The technical analysis of this story was written with the help of an AI tool. Know more.)
Recommended Articles


