


Crude Oil rises to a 22-week high on Gulf attacks
- WTI rises to a 22-week high and breaks above the band it held since Monday.
- Aramco clears its headquarters, and a tanker is hit as it leaves Hormuz.
- President Trump speaks at a Fort Myers rally Friday after his Iran remarks.
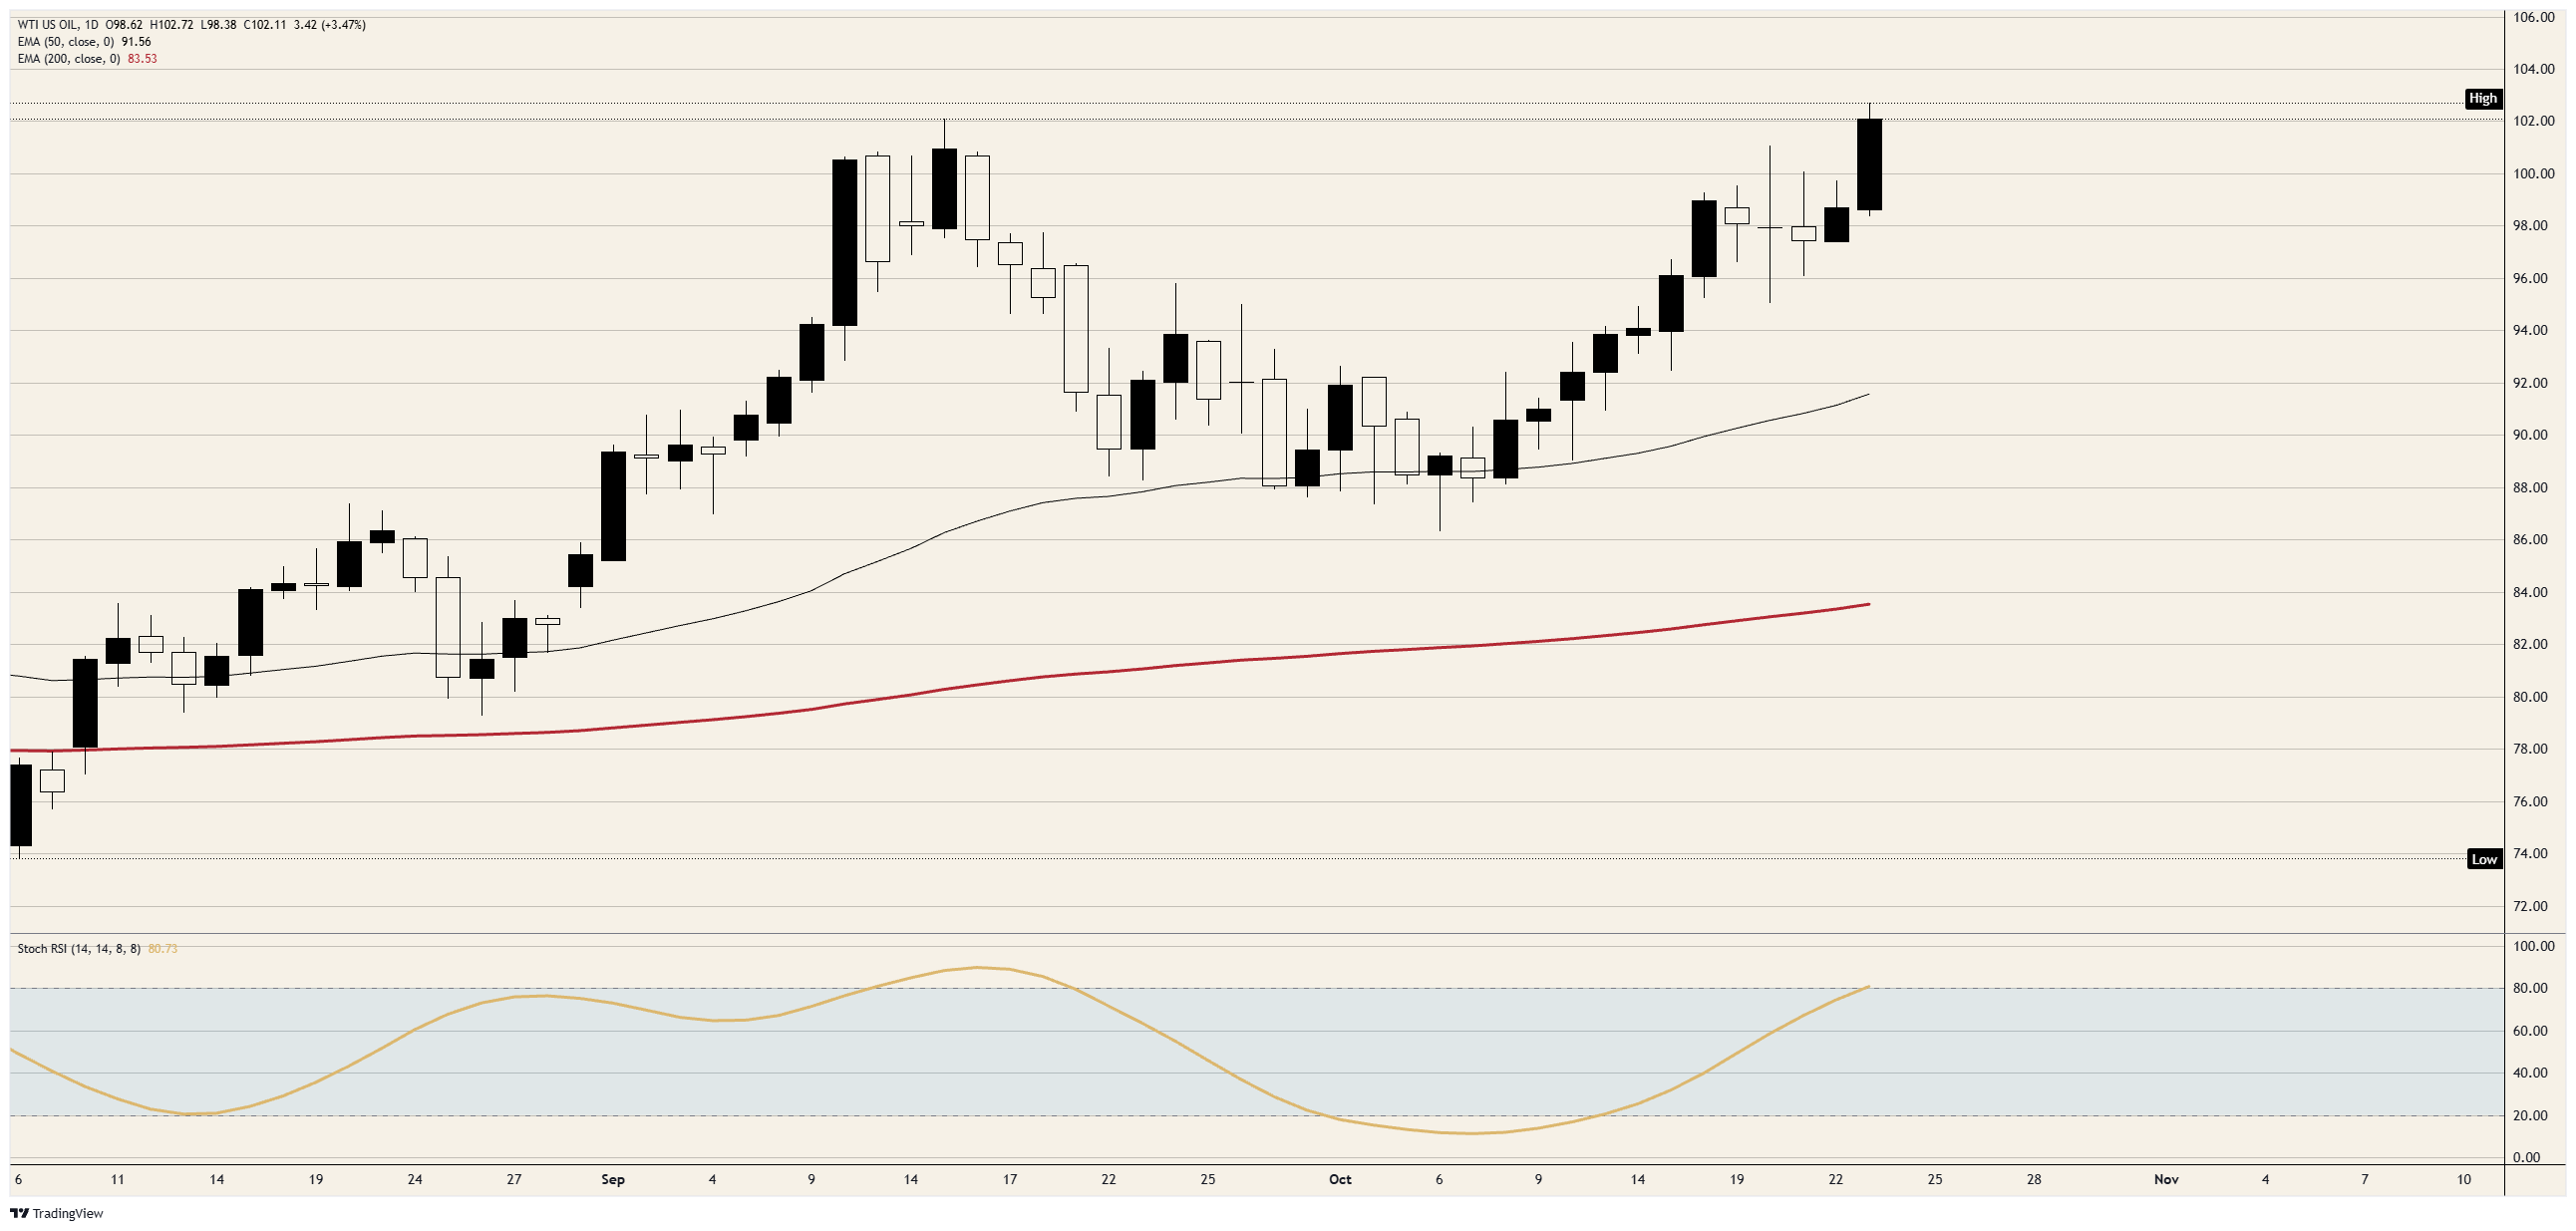
Two days of Houthi attacks in Saudi Arabia and strikes on ships leaving the Strait of Hormuz have taken WTI above the $95.00-$101.00 band it held from Monday to Thursday. It has risen from near $98.50 to just under $103.00, its highest in 22 weeks, and it's trading in the top fifth of the session's range.
Saudi Aramco (2222.SR) told its remaining staff on Thursday to leave its Dhahran headquarters, after debris from a Houthi drone killed two people at the Shaybah field. A tanker was hit by an unknown projectile as it left Hormuz near Limah in Oman, UK Maritime Trade Operations said on Friday. Both attacks land on supply still getting out of the Gulf, and WTI rose on Thursday and is higher again on Friday.
US Ambassador to the United Nations Waltz told the Financial Times the war could last another year, and President Trump said the US could end it very quickly. Ambassador Waltz said the Navy can keep Iran's ports blockaded for the foreseeable future, and Kpler expects that to cut Iran's Crude Oil revenue to zero by mid-December. On either timeline, Iran's barrels stay off a market already short of Gulf supply.
On the calendar
President Trump holds a midterm rally in Fort Myers, Florida, on Friday, after telling reporters the US is taking all the Crude Oil it wants out of Hormuz. US and Israeli planning for strikes on Iran after the November 3 midterms is going ahead, ABC News, The Atlantic and The New York Times report. Officials say no decision has been made, and those strikes would fall on Gulf supply that's already under attack.
On the charts
The high went past the September 15 peak just above $102.00, and the price is back near that peak. The climb from the August 6 low near $74.00 is now about $28, and the 50-day Exponential Moving Average (EMA) has risen to just above $91.50. Daily momentum has just reached overbought for the first time since mid-September.
WTI spot daily chart
WTI Oil FAQs
WTI Oil is a type of Crude Oil sold on international markets. The WTI stands for West Texas Intermediate, one of three major types including Brent and Dubai Crude. WTI is also referred to as “light” and “sweet” because of its relatively low gravity and sulfur content respectively. It is considered a high quality Oil that is easily refined. It is sourced in the United States and distributed via the Cushing hub, which is considered “The Pipeline Crossroads of the World”. It is a benchmark for the Oil market and WTI price is frequently quoted in the media.
Like all assets, supply and demand are the key drivers of WTI Oil price. As such, global growth can be a driver of increased demand and vice versa for weak global growth. Political instability, wars, and sanctions can disrupt supply and impact prices. The decisions of OPEC, a group of major Oil-producing countries, is another key driver of price. The value of the US Dollar influences the price of WTI Crude Oil, since Oil is predominantly traded in US Dollars, thus a weaker US Dollar can make Oil more affordable and vice versa.
The weekly Oil inventory reports published by the American Petroleum Institute (API) and the Energy Information Agency (EIA) impact the price of WTI Oil. Changes in inventories reflect fluctuating supply and demand. If the data shows a drop in inventories it can indicate increased demand, pushing up Oil price. Higher inventories can reflect increased supply, pushing down prices. API’s report is published every Tuesday and EIA’s the day after. Their results are usually similar, falling within 1% of each other 75% of the time. The EIA data is considered more reliable, since it is a government agency.
OPEC (Organization of the Petroleum Exporting Countries) is a group of 12 Oil-producing nations who collectively decide production quotas for member countries at twice-yearly meetings. Their decisions often impact WTI Oil prices. When OPEC decides to lower quotas, it can tighten supply, pushing up Oil prices. When OPEC increases production, it has the opposite effect. OPEC+ refers to an expanded group that includes ten extra non-OPEC members, the most notable of which is Russia.
Recommended Articles


