


Euro breaks to a 17-month low as US core inflation beats forecasts
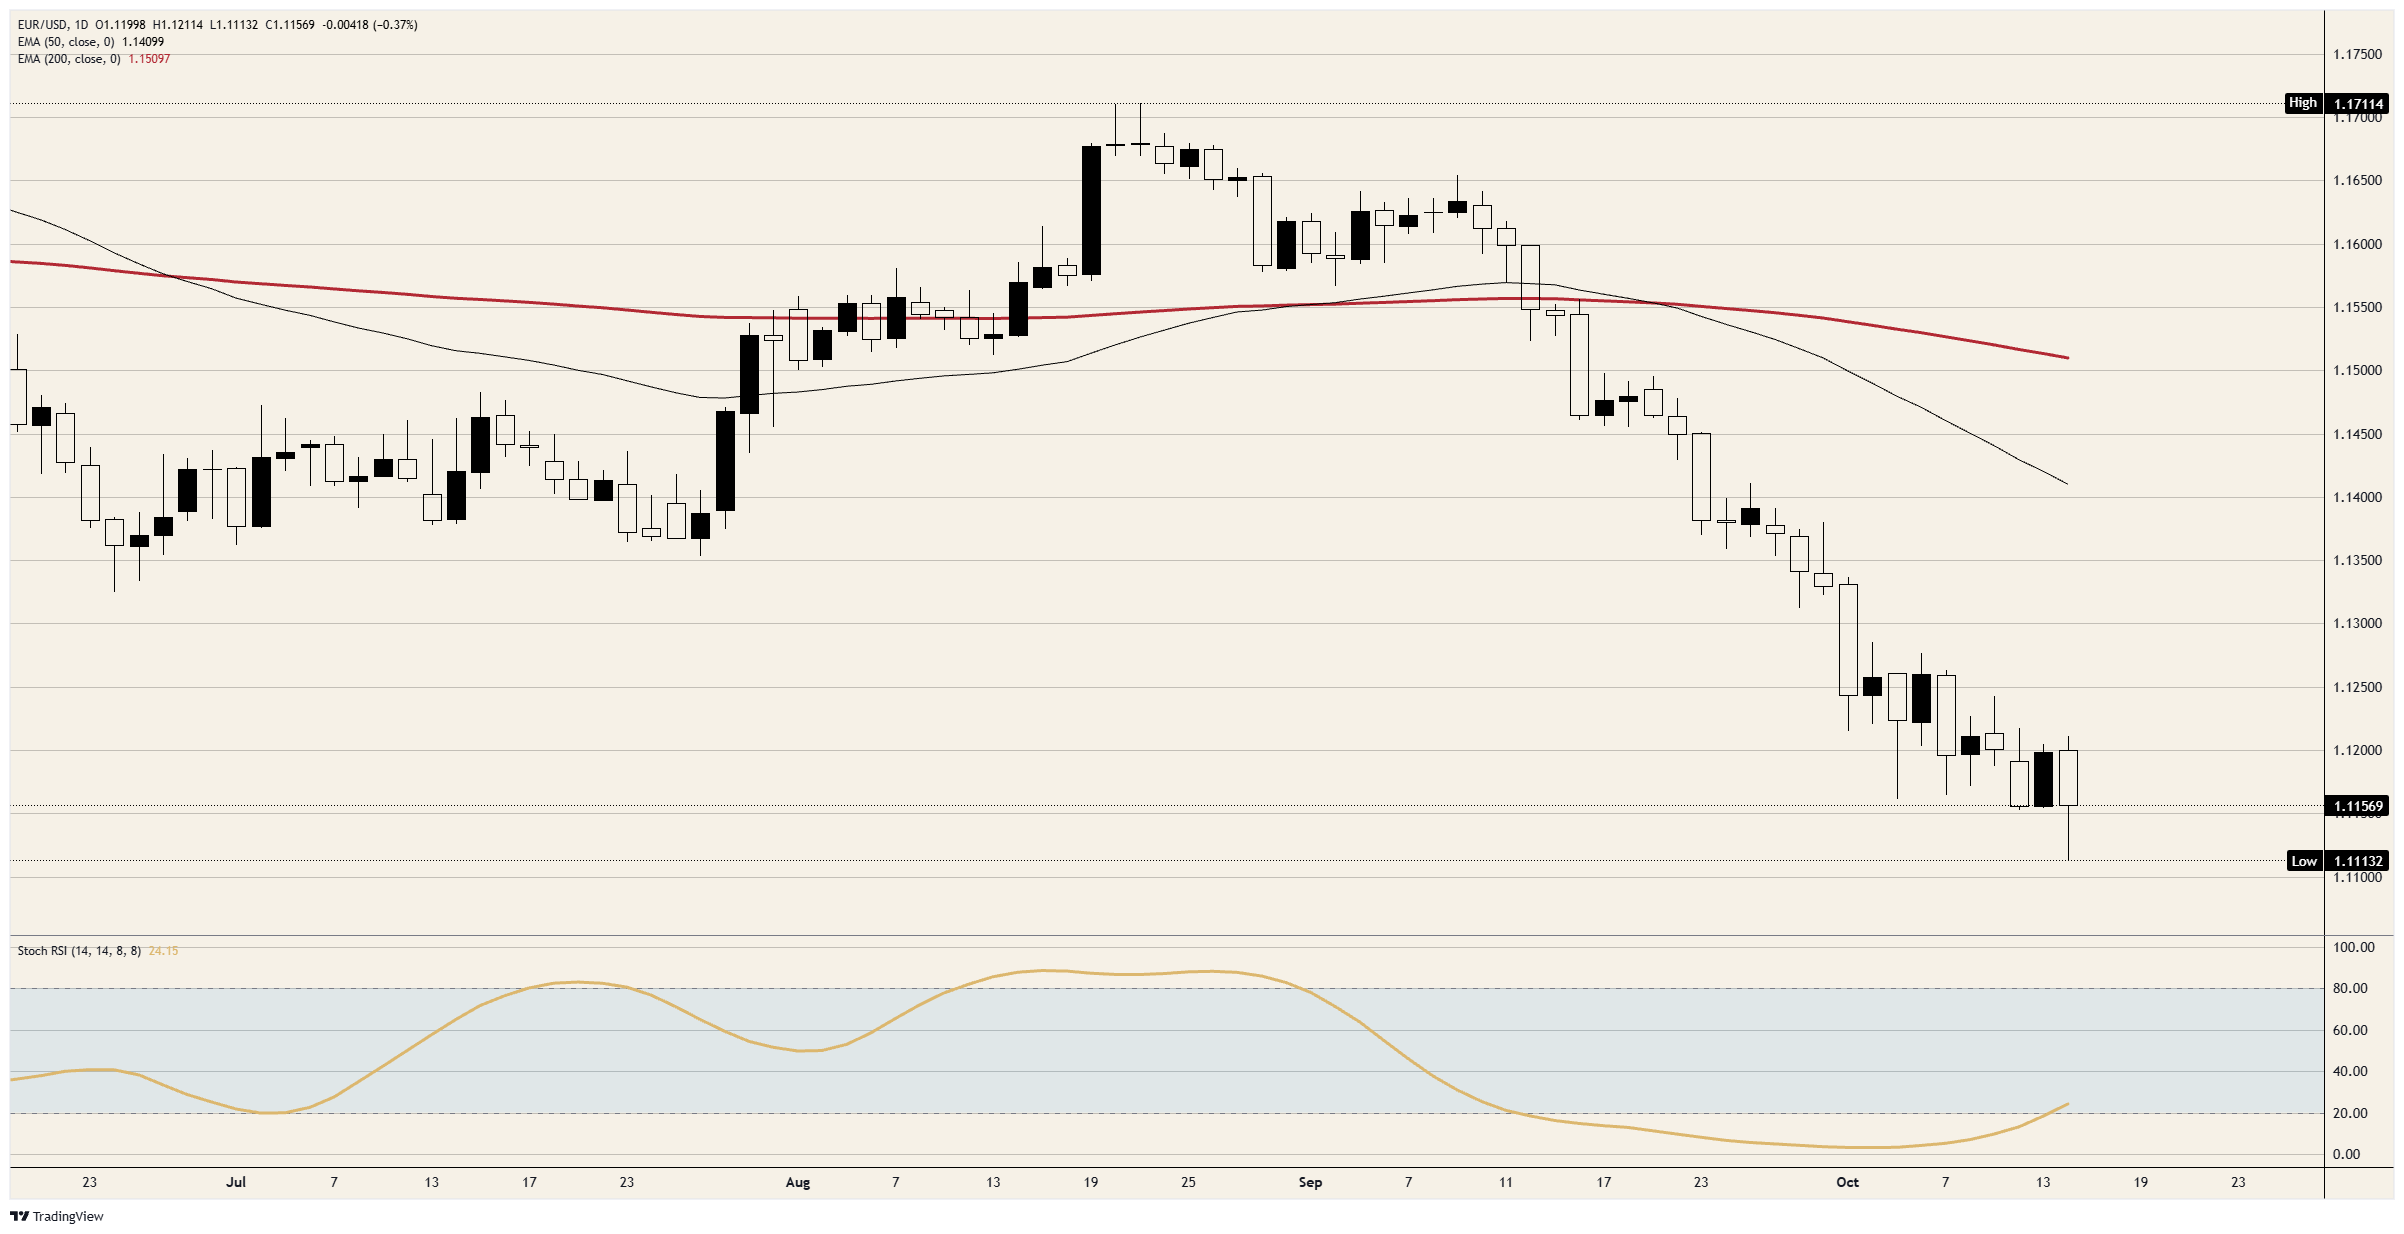
- EUR/USD breaks 1.1150 to a 17-month low just above 1.1100 on US inflation.
- US core prices rise 0.3% in September, and October Fed hike odds jump.
- Euro area inflation figures are due Friday, the day Fed Chair Warsh speaks.
1.1150 had stopped EUR/USD's fall four times since October 5, and it gave way on hotter US inflation figures, with the pair dropping to just above 1.1100, its lowest since May 2025. EUR/USD went through the level in the first five-minute bar after the release, made its low later in the session and is back at the old floor, having recovered about half of the drop.
Core US consumer prices, which exclude food and energy, rose 0.3% in September against a 0.2% forecast, with the headline rate at 3.7% for the year. Traders' odds on an October 28 Fed hike rose from about 20% before the release to about 50% after it, and have slipped since as Treasury yields fell back.
The European Central Bank (ECB) pays banks 2.50% on their deposits, against a Fed rate of 3.75%-4.00%. National Bank of Belgium Governor Wunsch said on Wednesday the ECB will probably have to raise rates again, and ECB President Lagarde said she isn't yet seeing energy costs spread into wages and other prices. The Fed decides on October 28 and the ECB on October 29, so a hike from each would leave the gap between the two rates exactly where it started.
On the calendar
Euro area industrial production for August comes out on Thursday, forecast flat after a 0.1% fall in July, and the final September inflation figures follow on Friday, with core prices forecast to hold at 2.5% for the year. Both feed into the ECB's October 29 decision, the European side of the gap.
US producer prices are due on Thursday, with the core measure forecast to slow to 4.4% for the year from 4.6%, alongside retail sales and the New York and Philadelphia Fed factory surveys. Fed Chair Warsh speaks on Friday, the last weekday before Fed officials stop commenting ahead of the October 28 decision.
On the charts
The 50-day Exponential Moving Average (EMA), just above 1.1400, and the 200-day EMA, just above 1.1500, are both overhead, and EUR/USD has been under both since mid-September. Daily momentum had been oversold for a month and had only just climbed out of it before the release.
EUR/USD daily chart
Euro FAQs
The Euro is the currency for the 20 European Union countries that belong to the Eurozone. It is the second most heavily traded currency in the world behind the US Dollar. In 2022, it accounted for 31% of all foreign exchange transactions, with an average daily turnover of over $2.2 trillion a day. EUR/USD is the most heavily traded currency pair in the world, accounting for an estimated 30% off all transactions, followed by EUR/JPY (4%), EUR/GBP (3%) and EUR/AUD (2%).
The European Central Bank (ECB) in Frankfurt, Germany, is the reserve bank for the Eurozone. The ECB sets interest rates and manages monetary policy. The ECB’s primary mandate is to maintain price stability, which means either controlling inflation or stimulating growth. Its primary tool is the raising or lowering of interest rates. Relatively high interest rates – or the expectation of higher rates – will usually benefit the Euro and vice versa. The ECB Governing Council makes monetary policy decisions at meetings held eight times a year. Decisions are made by heads of the Eurozone national banks and six permanent members, including the President of the ECB, Christine Lagarde.
Eurozone inflation data, measured by the Harmonized Index of Consumer Prices (HICP), is an important econometric for the Euro. If inflation rises more than expected, especially if above the ECB’s 2% target, it obliges the ECB to raise interest rates to bring it back under control. Relatively high interest rates compared to its counterparts will usually benefit the Euro, as it makes the region more attractive as a place for global investors to park their money.
Data releases gauge the health of the economy and can impact on the Euro. Indicators such as GDP, Manufacturing and Services PMIs, employment, and consumer sentiment surveys can all influence the direction of the single currency. A strong economy is good for the Euro. Not only does it attract more foreign investment but it may encourage the ECB to put up interest rates, which will directly strengthen the Euro. Otherwise, if economic data is weak, the Euro is likely to fall. Economic data for the four largest economies in the euro area (Germany, France, Italy and Spain) are especially significant, as they account for 75% of the Eurozone’s economy.
Another significant data release for the Euro is the Trade Balance. This indicator measures the difference between what a country earns from its exports and what it spends on imports over a given period. If a country produces highly sought after exports then its currency will gain in value purely from the extra demand created from foreign buyers seeking to purchase these goods. Therefore, a positive net Trade Balance strengthens a currency and vice versa for a negative balance.
Recommended Articles


