


USD/CHF Price Forecast: Testing support at 0.8300 with bearish momentum building up
- USD/CHF retreats to 0.8300 from 0.8345 highs on Thursday but remains on track for a seven-week rally.
- The US Dollar loses ground against its most peers as US Treasury yields pull back from multi-decade highs.
- Thursday's lower high and RSI divergence are giving bears some hope.
The US Dollar (USD) extends losses for the second consecutive day against the Swiss Franc (CHF) on Friday as some easing on the global bond rout has triggered a mild risk appetite, sending the US Dollar lower across the board. The USD/CHF pair is testing support at the 0.8300 area after a knee-jerk reaction at 0.8345 on Thursday, although it remains on track to complete a seven-week rally.
An auction for US 30-year Treasury bonds was received with strong demand on Thursday, which eased concerns about the bond crisis and triggered a moderate pullback in global yields. In this context, the safe-haven US Dollar has lost ground against its most peers, providing some support for the Swiss Franc and most of the G8 currencies, in an otherwise calm trading session.
Technical Analysis: Thursday's lower high gives hope for bears
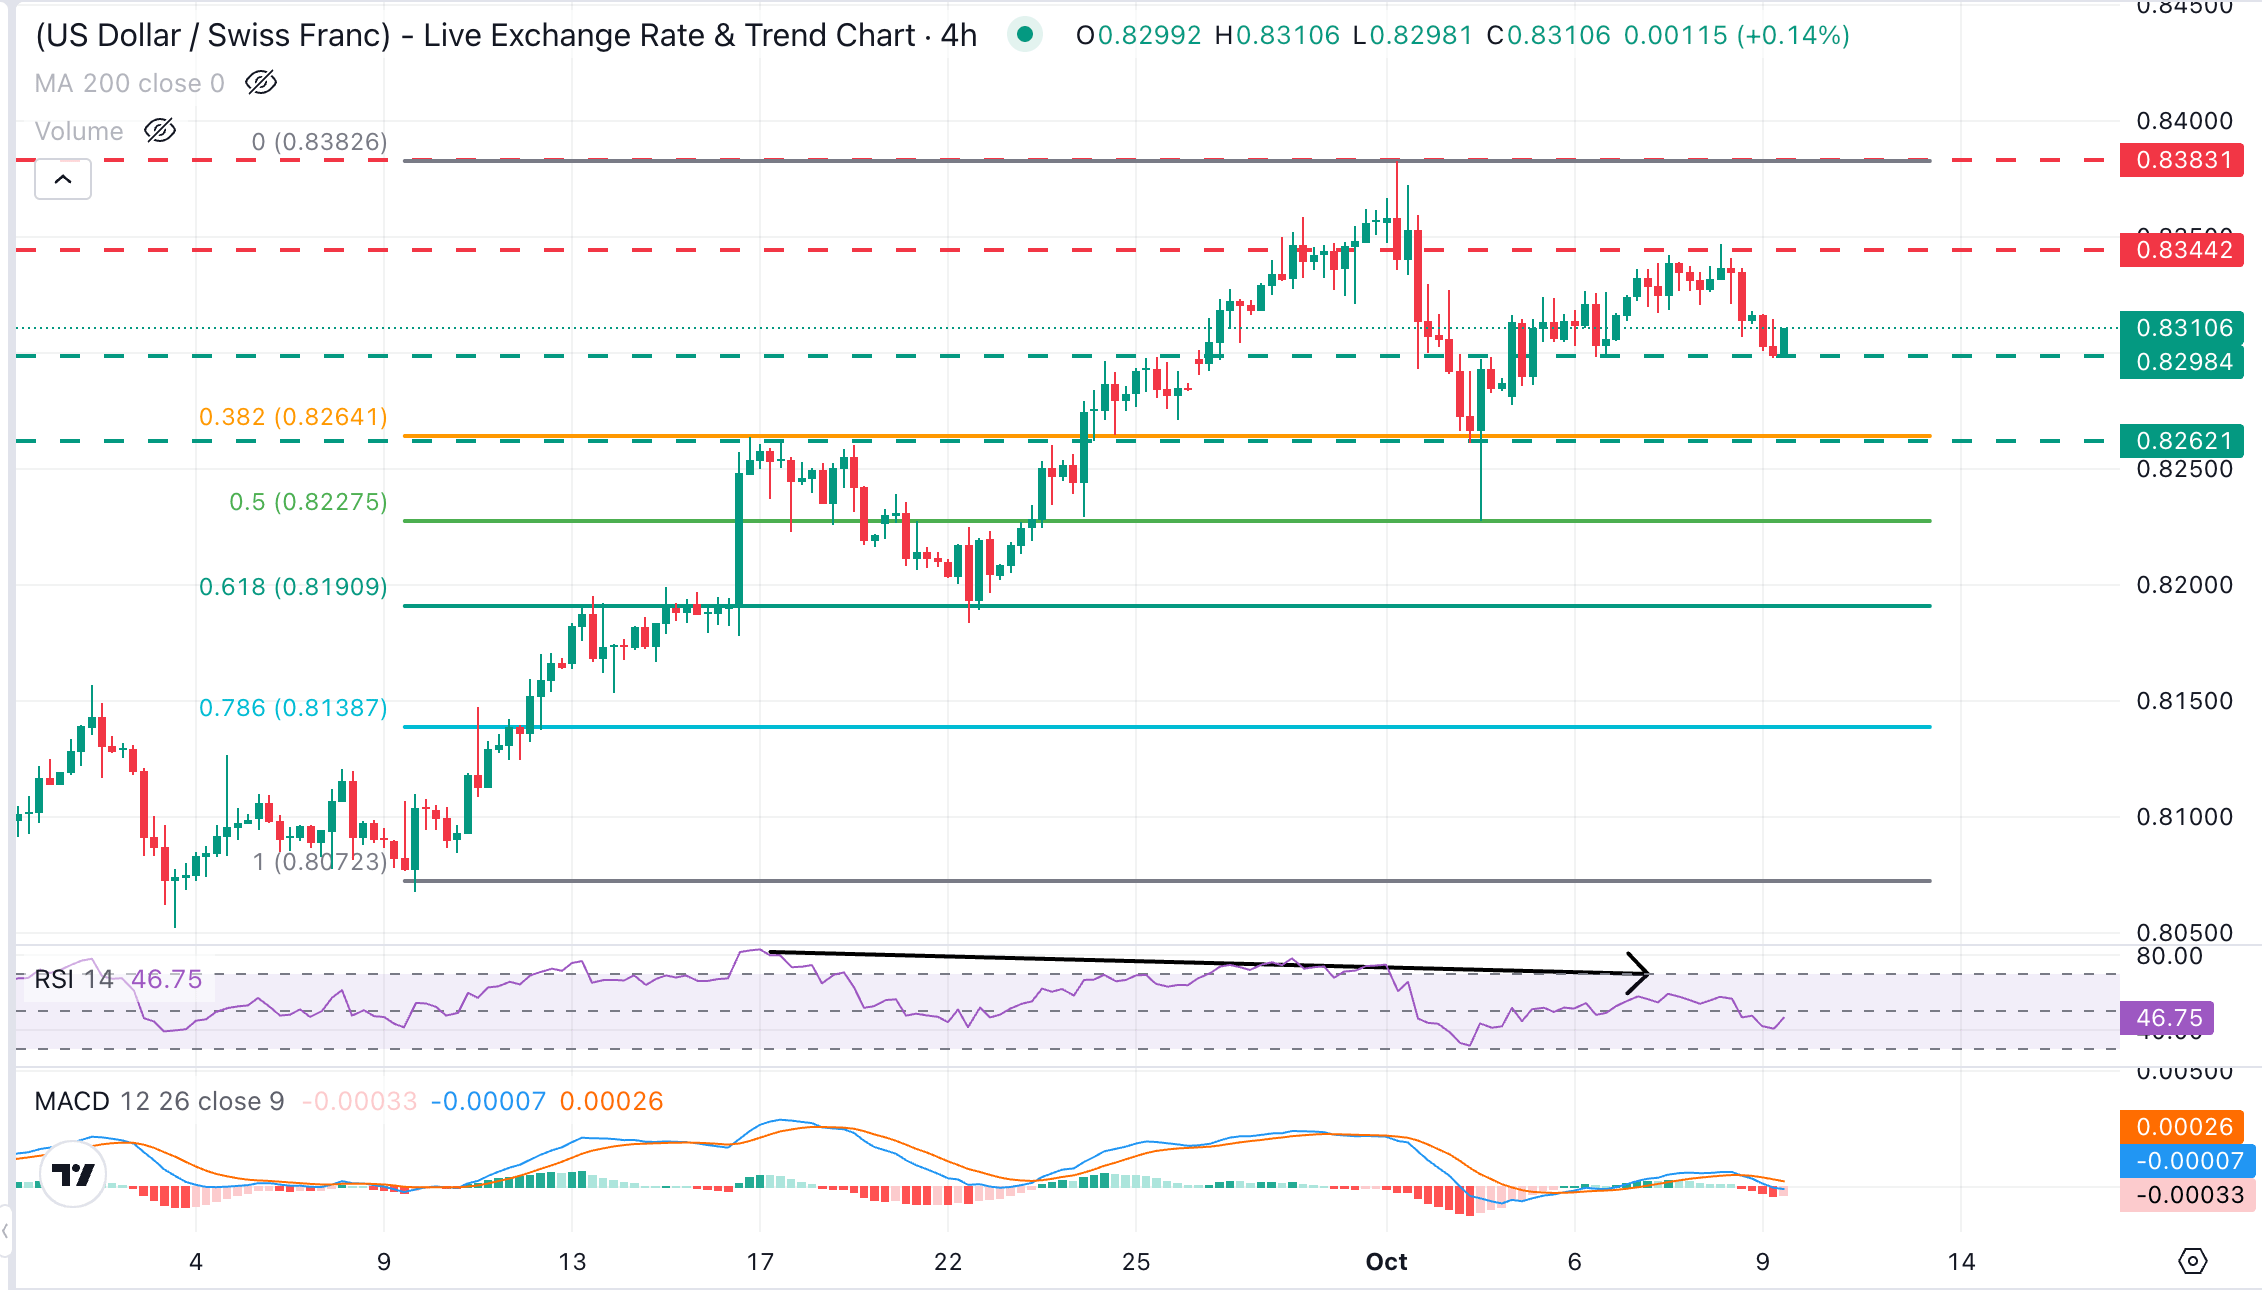
USD/CHF trades at 0.8304, after a rejection at 0.8345 on Thursday, posting a lower high, which suggests that bulls are starting to lose steam. The 4-hour Relative Strength Index (14), around 44, is showing a bearish divergence, while the Moving Average Convergence Divergence (MACD) has turned negative, altogether hinting at a deeper bearish correction.
Bears need to break support at the 0.8300 area (October 6 low) and the 38.2% Fibonacci retracement of September's rally, at 0.8264, to cement hopes of a trend shift and bring the October 2 and September 22 lows, at 0.8227 and 0.8183 respectively, into target.
To the upside, a bullish reaction above the mentioned Thursday's high at 0,8345 negates this view and shifts the focus back to the October 1 high, at the 0.8380 area.
(The technical analysis of this story was written with the help of an AI tool. Know more.)
US Dollar Price Today
The table below shows the percentage change of US Dollar (USD) against listed major currencies today. US Dollar was the strongest against the Japanese Yen.
| USD | EUR | GBP | JPY | CAD | AUD | NZD | CHF | |
|---|---|---|---|---|---|---|---|---|
| USD | -0.09% | -0.08% | 0.24% | 0.01% | -0.29% | -0.14% | -0.11% | |
| EUR | 0.09% | 0.02% | 0.34% | 0.10% | -0.20% | -0.03% | -0.03% | |
| GBP | 0.08% | -0.02% | 0.34% | 0.12% | -0.20% | 0.00% | 0.02% | |
| JPY | -0.24% | -0.34% | -0.34% | -0.22% | -0.54% | -0.37% | -0.33% | |
| CAD | -0.01% | -0.10% | -0.12% | 0.22% | -0.34% | -0.16% | -0.10% | |
| AUD | 0.29% | 0.20% | 0.20% | 0.54% | 0.34% | 0.17% | 0.24% | |
| NZD | 0.14% | 0.03% | 0.00% | 0.37% | 0.16% | -0.17% | 0.06% | |
| CHF | 0.11% | 0.03% | -0.02% | 0.33% | 0.10% | -0.24% | -0.06% |
The heat map shows percentage changes of major currencies against each other. The base currency is picked from the left column, while the quote currency is picked from the top row. For example, if you pick the US Dollar from the left column and move along the horizontal line to the Japanese Yen, the percentage change displayed in the box will represent USD (base)/JPY (quote).
Recommended Articles


