


The Federal Reserve hikes to 4%, six days after the ECB
- EUR/USD falls 31 pips in five minutes to the day's low on the Fed decision
- The ECB raised its own deposit rate a quarter-point to 2.50% six days ago
The Fed has raised its rate to 3.75-4.00%, its first increase since 2023 and its first move of any kind since the cut in December 2025. Six days ago the European Central Bank (ECB) raised its deposit rate, the return banks earn on money parked with it, by the same quarter-point to 2.50%. So both sides of this pair repriced inside a week. Take the middle of the new American range and the Fed pays 3.875% against the ECB's 2.50%, a gap of 1.375 points. The vote was unanimous at 12-0, and the statement said nothing about what comes next. That is exactly where the gap sat before either of them moved.
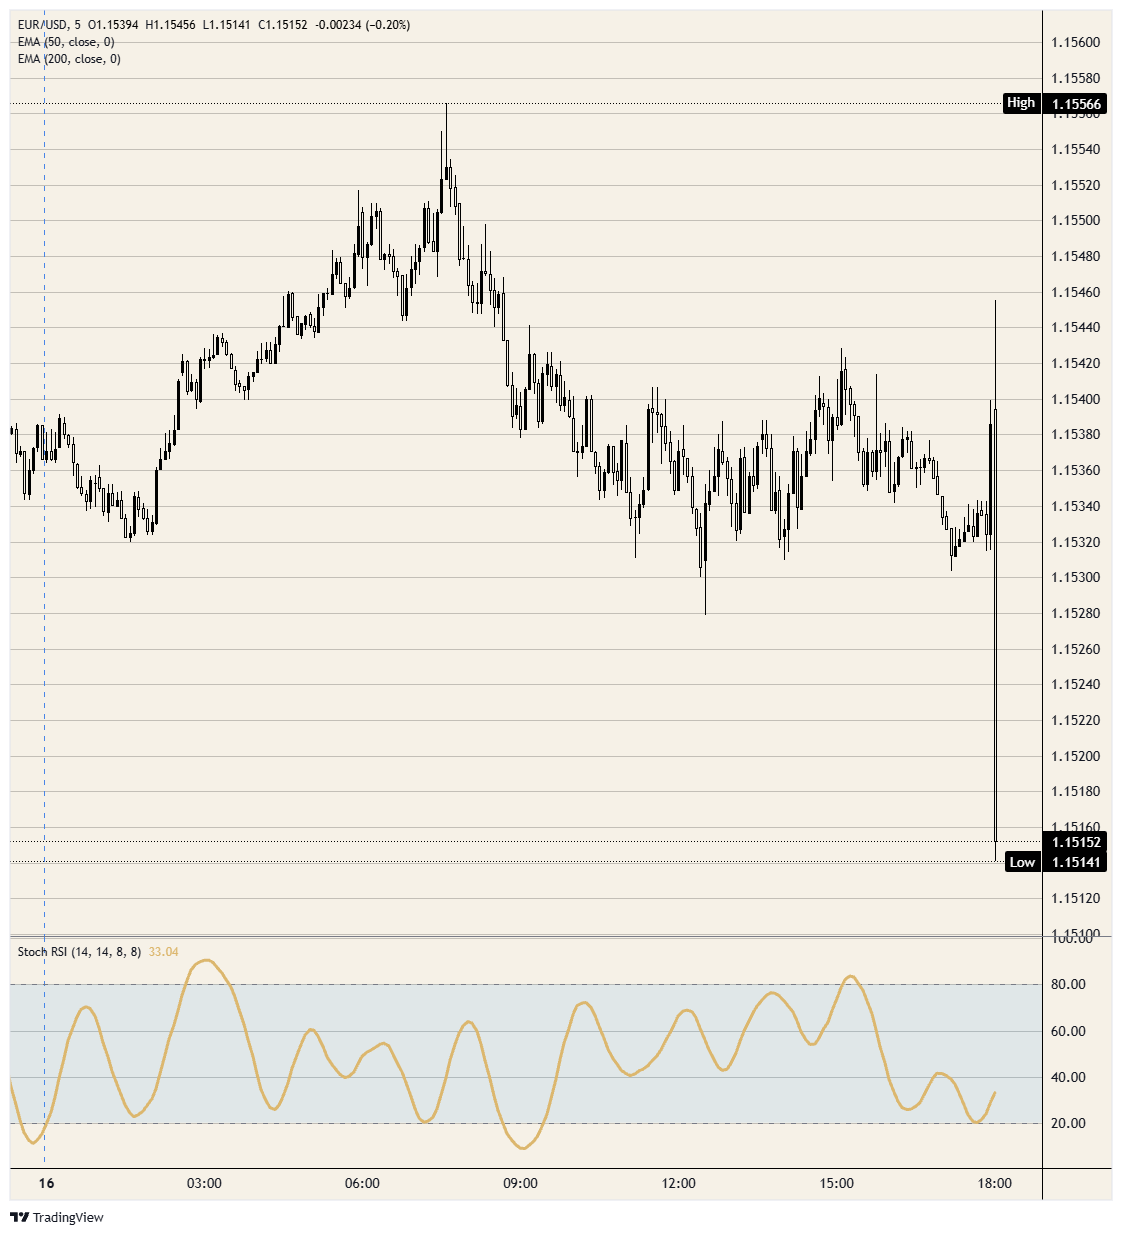
The whole reaction fits inside one five-minute bar. The pair ticked up on the release, then reversed and fell 31 pips before the bar was out, which is three-quarters of the range it had built all session. It changes hands in the 1.1500 area at the low of the day, roughly 20 pips below where it sat going into 18:00 GMT. The day's high just above 1.1550 was made in the European morning and is now 42 pips away. The five-minute momentum gauge reads near 33, which is mid-range, because the drop came faster than the indicator measures.
EUR/USD 5-minute chart
Fed FAQs
Monetary policy in the US is shaped by the Federal Reserve (Fed). The Fed has two mandates: to achieve price stability and foster full employment. Its primary tool to achieve these goals is by adjusting interest rates. When prices are rising too quickly and inflation is above the Fed’s 2% target, it raises interest rates, increasing borrowing costs throughout the economy. This results in a stronger US Dollar (USD) as it makes the US a more attractive place for international investors to park their money. When inflation falls below 2% or the Unemployment Rate is too high, the Fed may lower interest rates to encourage borrowing, which weighs on the Greenback.
The Federal Reserve (Fed) holds eight policy meetings a year, where the Federal Open Market Committee (FOMC) assesses economic conditions and makes monetary policy decisions. The FOMC is attended by twelve Fed officials – the seven members of the Board of Governors, the president of the Federal Reserve Bank of New York, and four of the remaining eleven regional Reserve Bank presidents, who serve one-year terms on a rotating basis.
In extreme situations, the Federal Reserve may resort to a policy named Quantitative Easing (QE). QE is the process by which the Fed substantially increases the flow of credit in a stuck financial system. It is a non-standard policy measure used during crises or when inflation is extremely low. It was the Fed’s weapon of choice during the Great Financial Crisis in 2008. It involves the Fed printing more Dollars and using them to buy high grade bonds from financial institutions. QE usually weakens the US Dollar.
Quantitative tightening (QT) is the reverse process of QE, whereby the Federal Reserve stops buying bonds from financial institutions and does not reinvest the principal from the bonds it holds maturing, to purchase new bonds. It is usually positive for the value of the US Dollar.
Recommended Articles


