


USD/CAD Price Forecast: Wobbles around 1.3800 ahead of US PPI data
- USD/CAD consolidates at around 1.3810 ahead of the US PPI data for August.
- Both the US headline and core PPI are expected to arrive higher.
- Investors also await the US CPI data scheduled for Friday.
The Canadian Dollar (CAD) trades sideways at around 1.3810 against the US Dollar (USD) during the European trading session on Thursday. The Loonie pair consolidates as investors await the United States (US) Producer Price Index (PPI) data for August, which will be published at 12:30 GMT.
Investors will closely track the US PPI data as it is expected to influence the overall inflation outlook and eventually Federal Reserve (Fed) interest rate expectations.
According to estimates, the US headline inflation at the factory level accelerated to 5.3% Year-on-Year (YoY) from 4.7% in July. The core PPI – which excludes volatile food and energy items – is also expected to arrive higher at 4.6% YoY against the previous reading of 4.2%.
Signs of price pressures accelerating at the producer level would prompt expectations of interest rate hikes by the Fed in the near term.
Currently, the CME FedWatch tool shows the odds of the Fed hiking interest rates at the policy meeting next week are 61.2%.
Going forward, investors will also focus on the US Consumer Price Index (CPI) data for August, which will be released on Friday.
USD/CAD Technical Analysis
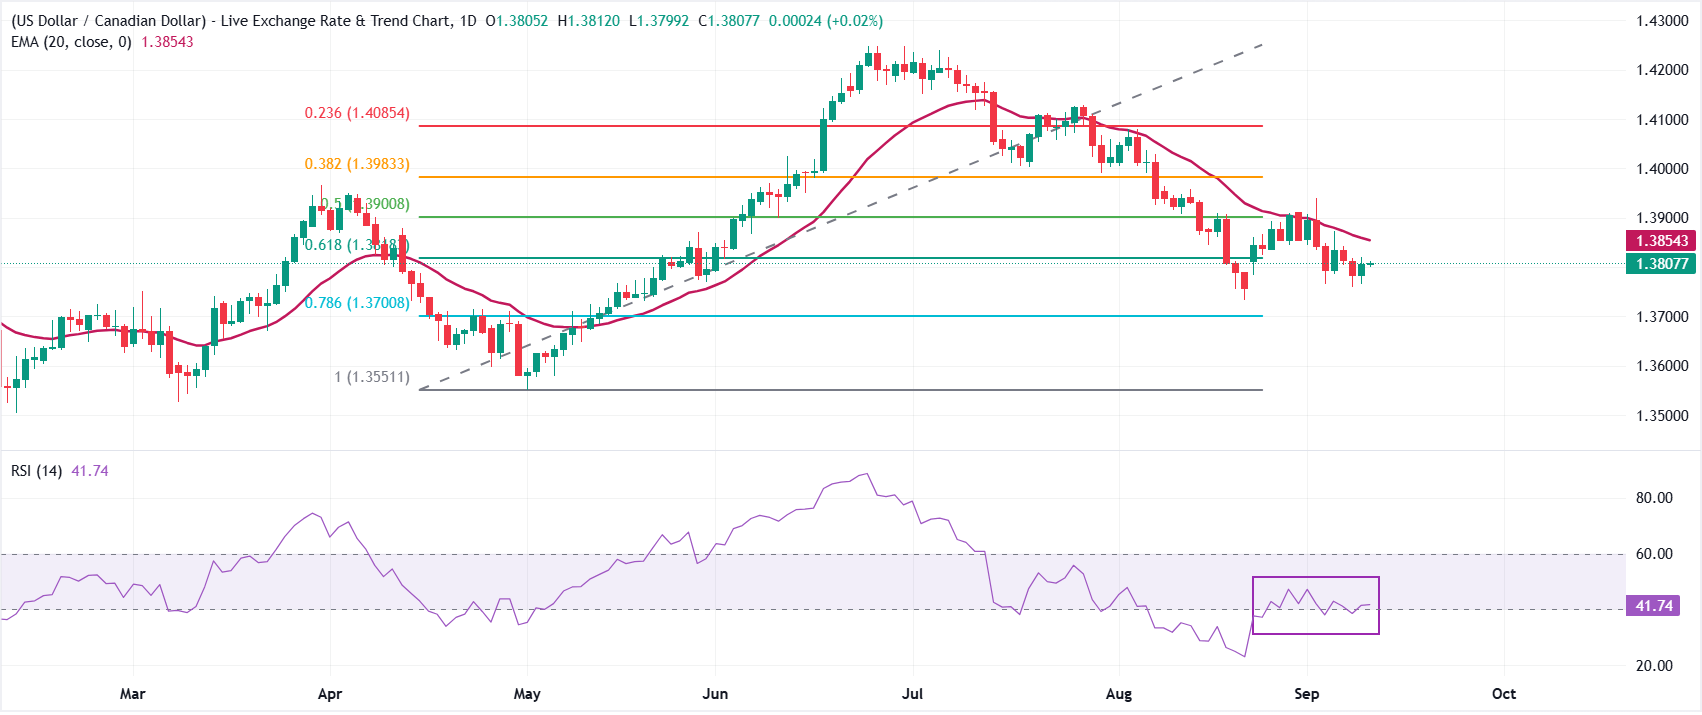
In the daily chart, USD/CAD trades at 1.3808, holding below the 20-day Exponential Moving Average (EMA) at 1.3854 and just under the 61.8% Fibonacci retracement at 1.3818, which together cap the upside and reinforce a mildly bearish near-term tone.
The Relative Strength Index (RSI) at 41.7 hovers below the neutral 50 line, suggesting weak upside momentum as the pair consolidates beneath these clustered resistances.
On the topside, immediate resistance is aligned at the 61.8% retracement at 1.3818, followed by the 20-day EMA at 1.3854, with further barriers at the 50% retracement near 1.3901 and then 1.3983 and 1.4085, corresponding to the 38.2% and 23.6% retracement levels. On the downside, initial support emerges at the 78.6% retracement around 1.3701, ahead of a more significant floor at the 100% retracement near 1.3551, where buyers would be expected to show stronger interest if the decline extends.
(The technical analysis of this story was written with the help of an AI tool. Know more.)
Economic Indicator
Producer Price Index (YoY)
The Producer Price Index released by the Bureau of Labor statistics, Department of Labor measures the average changes in prices in primary markets of the US by producers of commodities in all states of processing. Changes in the PPI are widely followed as an indicator of commodity inflation. Generally speaking, a high reading is seen as positive (or bullish) for the USD, whereas a low reading is seen as negative (or bearish).
Read more.Next release: Thu Sep 10, 2026 12:30
Frequency: Monthly
Consensus: 5.3%
Previous: 4.7%
Source: US Bureau of Labor Statistics
Recommended Articles


