

GBP/JPY Price Forecast: Bulls stall near 216.00 as RSI flattens

Source Fxstreet
  • GBP/JPY holds near 216.00 as buyers lose momentum.
  • Flat bullish RSI signals consolidation before next directional move.
  • Break below 215.56 exposes 214.71 and 212.35 supports.

The GBP/JPY consolidates at familiar levels on Tuesday, virtually unchanged near 216.00, with the cross-pair seesawing within the 215.85-216.22 range, as neither buyers nor sellers are able to clear key resistance/support levels during the day.

GBP/JPY Price Forecast: Technical Outlook

The GBP/JPY is neutral to upward biased, though the last intervention between US and Japanese authorities prevented investors from opening fresh long or short bets. Bullish momentum has faded even though the Relative Strength Index (RSI) remains bullish. Nevertheless, as it turned flat, a potential consolidation lies ahead.

Upwards, the first key resistance is 217.00, followed by a downward resistance trendline near 217.50/65. Above this area, up next is the July 9 high of the day (HOD) at 218.01.

On the flip side, a drop below the 50-day SMA at 215.56 opens the door to further downside. Below lies the 100-day SMA of  214.71, ahead of the 200-day SMA at 212.35.

GBP/JPY Price Chart – Daily
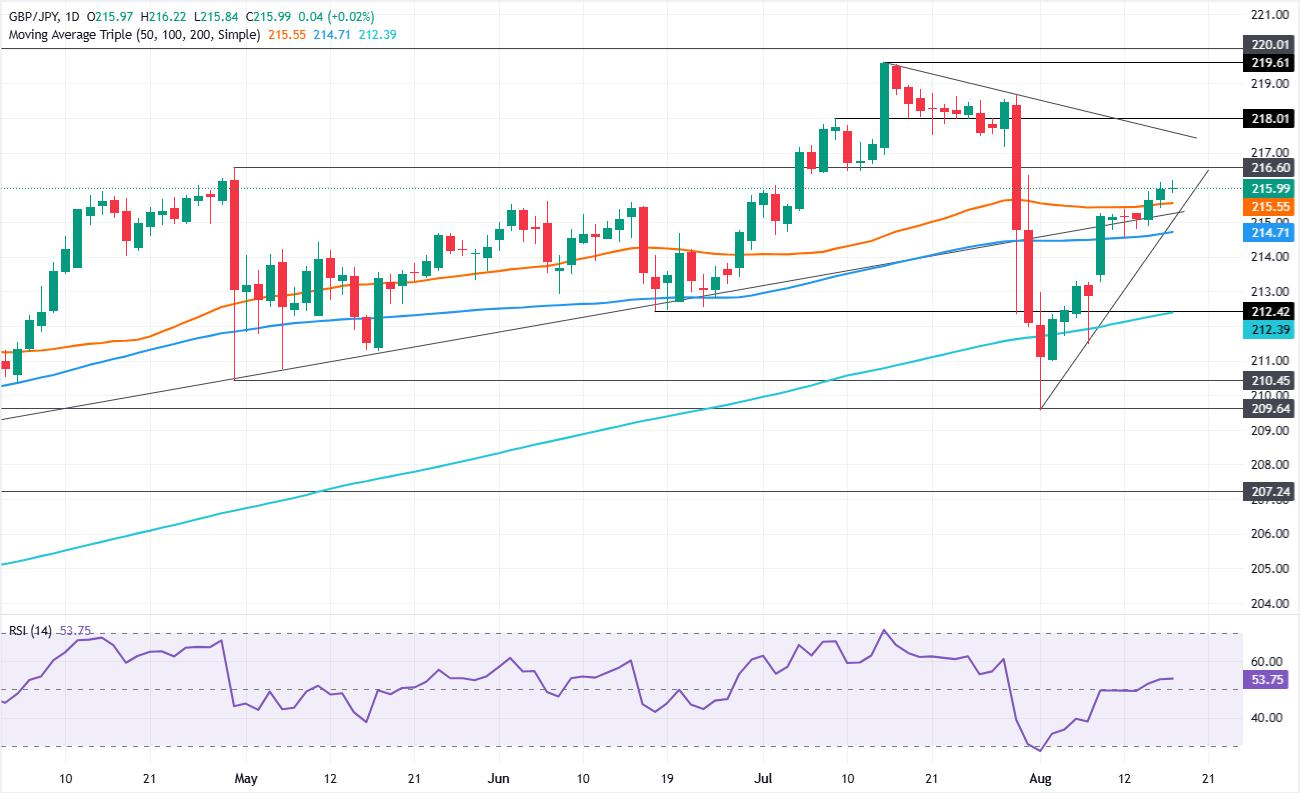
GBP/JPY daily chart

Japanese Yen Price This week

The table below shows the percentage change of Japanese Yen (JPY) against listed major currencies this week. Japanese Yen was the strongest against the New Zealand Dollar.

USD EUR GBP JPY CAD AUD NZD CHF
USD -0.09% -0.07% 0.18% 0.16% 0.05% 0.26% 0.03%
EUR 0.09% 0.17% 0.28% 0.25% 0.10% 0.35% 0.13%
GBP 0.07% -0.17% 0.17% 0.10% -0.07% 0.18% -0.09%
JPY -0.18% -0.28% -0.17% -0.01% -0.19% 0.06% -0.17%
CAD -0.16% -0.25% -0.10% 0.01% -0.16% 0.08% -0.17%
AUD -0.05% -0.10% 0.07% 0.19% 0.16% 0.25% -0.01%
NZD -0.26% -0.35% -0.18% -0.06% -0.08% -0.25% -0.27%
CHF -0.03% -0.13% 0.09% 0.17% 0.17% 0.01% 0.27%

The heat map shows percentage changes of major currencies against each other. The base currency is picked from the left column, while the quote currency is picked from the top row. For example, if you pick the Japanese Yen from the left column and move along the horizontal line to the US Dollar, the percentage change displayed in the box will represent JPY (base)/USD (quote).

Disclaimer: For information purposes only. Past performance is not indicative of future results.
placeholder
XRP Price Prediction for July 2026: Can Buyers Finally Break the Downtrend?XRP (XRP) price trades near $1.05, caught between a year-long downtrend and a sudden burst of buying.July has historically rewarded XRP holders. This year the month arrives with on-chain accumulation
Author  Beincrypto
Jun 30, Tue
XRP (XRP) price trades near $1.05, caught between a year-long downtrend and a sudden burst of buying.July has historically rewarded XRP holders. This year the month arrives with on-chain accumulation
placeholder
What to Expect From Ethereum (ETH) in July 2026Ethereum (ETH) enters July 2026 trading near $1,570, close to multi-month lows, after recording its first run of three consecutive red quarterly candles in its history.On-chain data and price charts n
Author  Beincrypto
Jul 01, Wed
Ethereum (ETH) enters July 2026 trading near $1,570, close to multi-month lows, after recording its first run of three consecutive red quarterly candles in its history.On-chain data and price charts n
placeholder
XAUUSD Gold Analysis: Gold Holds Above $4,350 Ahead of US Inflation Data Is $4,500 Next? Gold holds above $4,350 following weak US jobs data. As inflation reports approach and UBS eyes $5,000, can XAUUSD break resistance at $4,435 to rally toward $4,500?
Author  Naoufal Seddik
Aug 12, Wed
Gold holds above $4,350 following weak US jobs data. As inflation reports approach and UBS eyes $5,000, can XAUUSD break resistance at $4,435 to rally toward $4,500?
placeholder
Gold Price Analysis Today: Gold Drops 1.32% Despite Lower Fed Rate-Hike Bets, Can $4,313 Support Hold? Gold fell 1.32% on August 13 after rising to $4,449.73, then reversing lower and closing near $4,349.918 below the $4,356.46 support. Softer US inflation data reduced Fed rate hike expectations, but selling pressure still dominated the session. Will $4,313 support hold?
Author  Naoufal Seddik
Aug 14, Fri
Gold fell 1.32% on August 13 after rising to $4,449.73, then reversing lower and closing near $4,349.918 below the $4,356.46 support. Softer US inflation data reduced Fed rate hike expectations, but selling pressure still dominated the session. Will $4,313 support hold?
placeholder
Gold Price Analysis Today: Gold Gains 0.94% as Markets Expect Fed to Hold Rates, Can $4,449 Resistance Break? Gold gained 0.94% on August 17, closing near $4,417.30 as softer US data strengthened expectations for unchanged Fed rates in September. Gold remains bullish, with $4,449.730 resistance and $4,310.650 support in focus.
Author  Naoufal Seddik
19 hours ago
Gold gained 0.94% on August 17, closing near $4,417.30 as softer US data strengthened expectations for unchanged Fed rates in September. Gold remains bullish, with $4,449.730 resistance and $4,310.650 support in focus.
Related Instrument
goTop
quote