


EUR/JPY Price Forecast: Trades near 181.50 after rebounding from eight-month highs
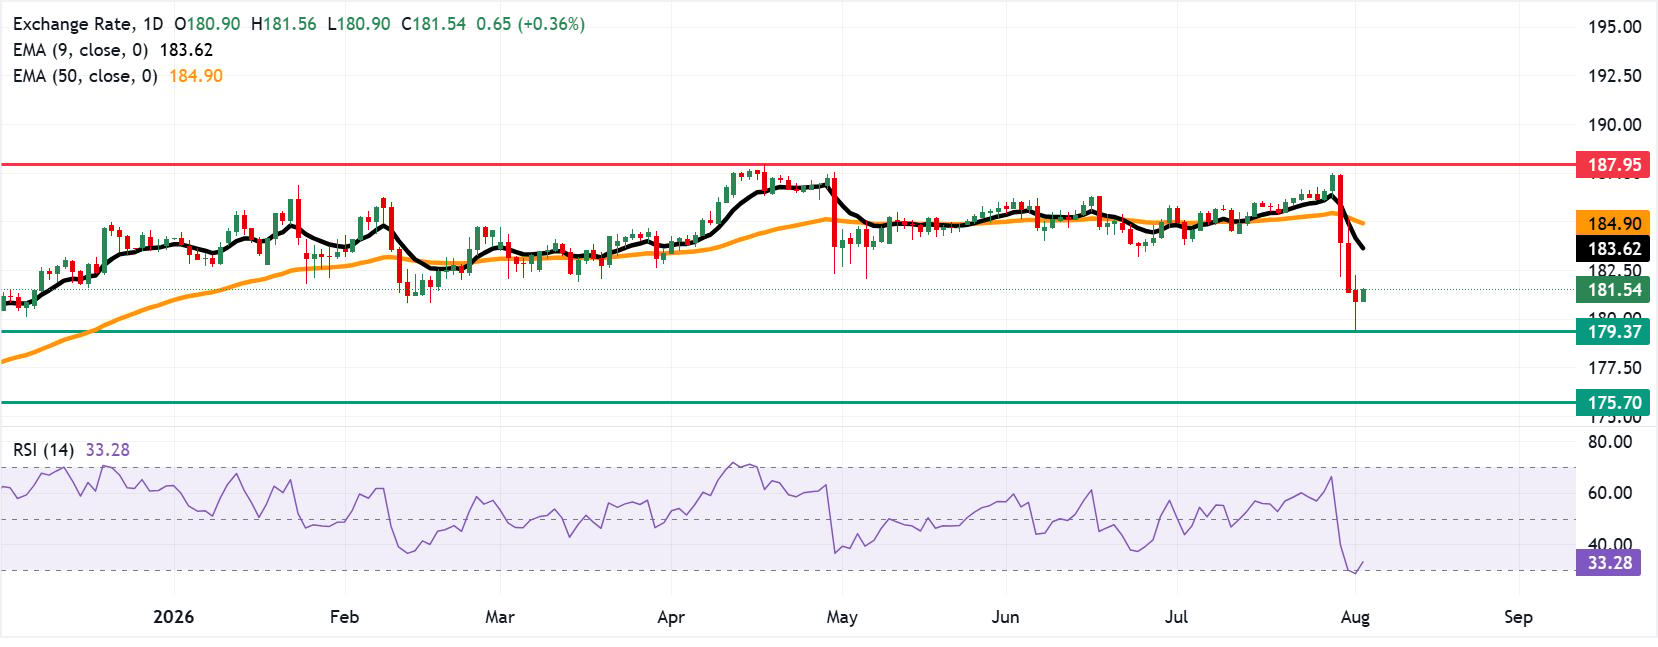
- EUR/JPY may fall toward the immediate support at the eight-month low of 179.37.
- The 14-day Relative Strength Index at 32.97 signals dominant downside momentum.
- The initial resistance lies at the nine-day EMA at 183.62.
EUR/JPY gains ground after three days of losses, trading around 181.50 during the Asian hours on Tuesday. The currency cross is maintaining a bearish near-term tone as it holds beneath both the nine-day and 50-day Exponential Moving Averages (EMAs).
The EUR/JPY cross is retreating away from recent highs, while the 14-day Relative Strength Index (RSI) at 32.97 hovers just above oversold territory, hinting that downside momentum is still dominant but nearing stretched conditions.
The EUR/JPY cross may retest the initial support at the eight-month low of 179.37, reached on August 3. Further support lies at the nine-month low of 175.70.
On the upside, the EUR/JPY cross could rise toward the nine-day EMA at 183.62, followed by the 50-day EMA at 184.90. Further advances above these moving averages would cause a bullish emergence and support the currency cross to explore the region around the all-time high of 187.95, which was recorded on April 17.
Yen positioning seen shifting after Japan-US intervention
Strategists at Rabobank highlight that "JPY net shorts had climbed to their highest levels since 2024 last week," just before the "concerted intervention from the MoF and the US Treasury to stem the weakness in the JPY." The bank argues that this official action "suggests that positioning is likely to be sharply changed in the next data release," but cautions that "it is too early to assess whether Japan’s fundamentals have strengthened sufficiently to allow the JPY to hold better levels vs. the USD in the spot market over the medium-term."
(The technical analysis of this story was written with the help of an AI tool. Know more.)
Euro Price Today
The table below shows the percentage change of Euro (EUR) against listed major currencies today. Euro was the strongest against the Japanese Yen.
| USD | EUR | GBP | JPY | CAD | AUD | NZD | CHF | |
|---|---|---|---|---|---|---|---|---|
| USD | -0.04% | 0.03% | 0.24% | -0.04% | -0.32% | 0.03% | -0.08% | |
| EUR | 0.04% | 0.05% | 0.29% | -0.00% | -0.29% | 0.05% | -0.03% | |
| GBP | -0.03% | -0.05% | 0.23% | -0.05% | -0.33% | 0.00% | -0.08% | |
| JPY | -0.24% | -0.29% | -0.23% | -0.27% | -0.55% | -0.23% | -0.19% | |
| CAD | 0.04% | 0.00% | 0.05% | 0.27% | -0.28% | 0.06% | -0.03% | |
| AUD | 0.32% | 0.29% | 0.33% | 0.55% | 0.28% | 0.34% | 0.25% | |
| NZD | -0.03% | -0.05% | -0.01% | 0.23% | -0.06% | -0.34% | -0.08% | |
| CHF | 0.08% | 0.03% | 0.08% | 0.19% | 0.03% | -0.25% | 0.08% |
The heat map shows percentage changes of major currencies against each other. The base currency is picked from the left column, while the quote currency is picked from the top row. For example, if you pick the Euro from the left column and move along the horizontal line to the US Dollar, the percentage change displayed in the box will represent EUR (base)/USD (quote).
Recommended Articles


