


Solana (SOLUSD) Is down 1.14% on Oct 27: Key Drivers to Watch
Solana (SOLUSD) is down 1.14% at Oct 27 06:15(ET), now at $98.2, with a 7-day down of 7.14%.
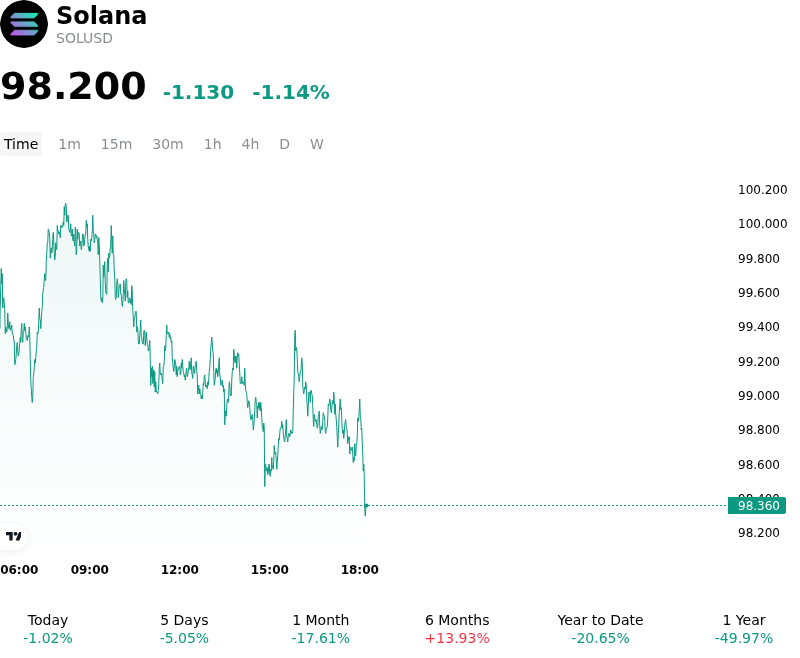
What is driving Solana (SOLUSD)’s stock price down today?
Solana faced downside pressure as broad cryptocurrency market sentiment turned cautious ahead of upcoming Federal Reserve monetary policy deliberations and macro economic data releases. Risk-off positioning across digital assets led to reduced institutional participation, driven by capital withdrawals from major crypto products and heightened caution surrounding interest rate guidance. This macro-driven risk aversion restricted new capital inflows into high-beta Layer-1 assets, leaving Solana vulnerable to localized spot order-book supply imbalances.
The primary asset-specific catalyst for the downward pressure stemmed from significant on-chain whale distribution activity. Blockchain data showed newly active high-value wallets transferring hundreds of thousands of SOL onto major centralized exchanges in structured tranches. This steady flow of tokens into exchange wallets generated continuous spot selling pressure and overhead supply friction. Although the Solana ecosystem experienced structural network activity growth—including expanded address metrics for tokenized equities and stablecoins—these transactions generate minimal network fees and do not directly convert into spot buying demand necessary to absorb large whale liquidations.
From a derivatives and market structure perspective, positioning dynamics accelerated the retreat. Taker buy-to-sell ratios shifted toward aggressive market selling, reflecting short-term order-flow imbalance driven by spot liquidations and hedge rebalancing. As prices slipped beneath short-term technical moving averages, elevated long positioning across retail and leveraged accounts triggered targeted long liquidations, reinforcing downward momentum. Institutional market participants continue to monitor key support zones near long-term moving averages to determine whether ongoing exchange deposits will subside or prompt further structural repricing.
Technical Analysis of Solana (SOLUSD)
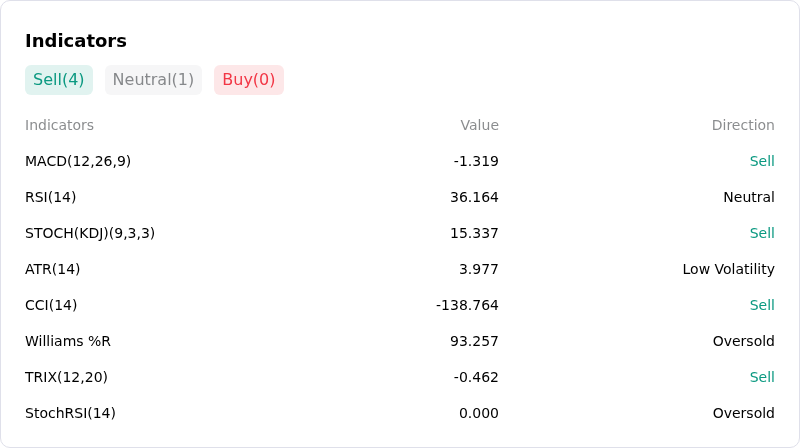
Technically, Solana (SOLUSD) shows a MACD (12,26,9) value of -1.319, indicating a sell signal. The RSI at 36.164 suggests neutral condition and the Williams %R at 93.257 suggests oversold condition. Please monitor closely.
More details about Solana (SOLUSD)
Recent Events and Risks:
- Leveraged Long Liquidations and Futures Unwind: Intraday volatility has heightened following a breakdown in key price levels that triggered a cascade of long liquidations in Solana perpetual futures, rapidly flushing out heavily long-skewed leverage across derivative exchanges.
- Sustained Spot ETF Outflows: Institutional demand has weakened, with spot Solana exchange-traded funds experiencing persistent net daily redemptions, removing a key source of structural buying liquidity and compounding selling pressure.
- Technical Support Breakdown and Bearish Patterns: SOLUSD faces heightened downward momentum following a loss of key support around the $100–$102 range, confirming bearish technical setups such as a head-and-shoulders pattern on daily timeframes and risking a deeper pullback toward lower support zones.
- Macro Risk-Off Pressures and Yield Spikes: Broad digital asset market sentiment remains defensive due to sticky inflation data and elevated U.S. Treasury yields ahead of Federal Reserve policy decisions, driving systemic deleveraging out of high-beta altcoins like Solana.
Recommended Articles


