


Eli Lilly and Co Stock (LLY) Moved Down by 3.33% on Oct 23: Drivers Behind the Movement
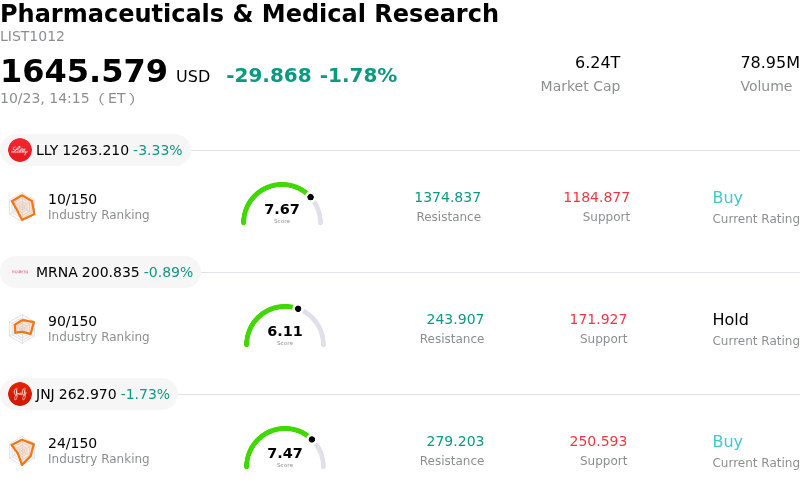
Eli Lilly and Co (LLY) moved down by 3.33%. The Pharmaceuticals & Medical Research sector is down by 1.78%. The company underperformed the industry. Top 3 stocks by turnover in the sector: Eli Lilly and Co (LLY) down 3.33%; Moderna Inc (MRNA) down 0.89%; Johnson & Johnson (JNJ) down 1.73%.
What is driving Eli Lilly and Co (LLY)’s stock price down today?
Eli Lilly experienced downward pressure as investors engaged in profit-taking following a strong rally to new all-time highs earlier in the week. The stock had previously gathered momentum fueled by positive Wall Street analyst price target revisions and long-term expansion initiatives, including the groundbreaking of a major domestic manufacturing facility to support its pharmaceutical pipeline. However, as the company approaches its scheduled third-quarter earnings release, market participants elected to lock in gains and rebalance portfolios after the extended move higher.
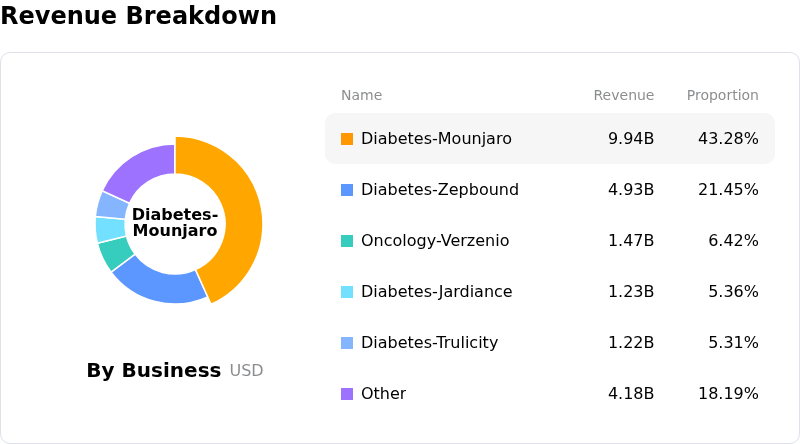
Investor sentiment ahead of the quarterly report reflects high expectations for flagship cardiometabolic treatments, notably Mounjaro and Zepbound. While volume demand for tirzepatide treatments remains robust both domestically and internationally, market focus has increasingly turned to realized net pricing dynamics, rebate structures, and expanding coverage initiatives. Furthermore, potential accounting adjustments related to acquired research and development expenses could create temporary noise in headline profit metrics, prompting institutional investors to take a disciplined posture prior to management's guidance updates.
Competitive dynamics across the metabolic space also play a central role in short-term trading strategy. With ongoing developments in oral GLP-1 therapies and competing obesity pipelines, investors are carefully weighing market share trajectories and capital expenditure commitments. Given the company's premium valuation relative to the broader pharmaceutical sector, shares remain sensitive to short-term shifts in sentiment when elevated expectations are already reflected in valuation multiples.
Overall, the pullback reflects typical consolidation and pre-earnings repositioning within a broader growth framework. Fundamentals driven by strong product demand, extensive manufacturing expansion, and pipeline progression continue to underpin institutional interest, while short-term volatility highlights market caution in front of upcoming financial disclosures.
Technical Analysis of Eli Lilly and Co (LLY)
Technically, Eli Lilly and Co (LLY) shows a MACD (12,26,9) value of 20.828, indicating a buy signal. The RSI at 59.944 suggests neutral condition and the Williams %R at 30.689 suggests buy condition. Please monitor closely.
Media Coverage of Eli Lilly and Co (LLY)
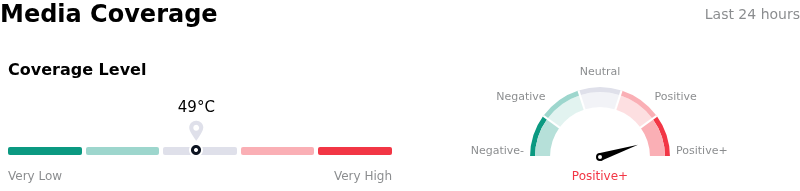
In terms of media coverage, Eli Lilly and Co (LLY) shows a coverage score of 49, indicating a moderate level of media attention. The overall market sentiment index is currently in extremely bullish zone.
Fundamental Analysis of Eli Lilly and Co (LLY)
Eli Lilly and Co (LLY) is in the Pharmaceuticals & Medical Research industry. Its latest annual revenue is $65.18B, ranking 4 in the industry. The net profit is $20.64B, ranking 2 in the industry. Company Profile
Over the past month, multiple analysts have rated the company as Buy, with an average price target of $1316.96, a high of $1600.00, and a low of $891.22.
More details about Eli Lilly and Co (LLY)
Company Specific Risks:
- Realized Price Compression in Key Franchises: Recent financial data indicates that average realized prices for core GLP-1 therapies Mounjaro and Zepbound fell 13% year-over-year, exposing earnings to severe margin risks if volume growth cannot offset ongoing pricing pressure and competitive discounting.
- Post-Peak Volatility Ahead of Q3 Earnings: Following an all-time high of $1,311.21 on October 20, shares experienced intraday exhaustion and profit-taking, leaving the elevated valuation exposed to high options-implied earnings volatility (6.6% expected move) heading into the October 29 earnings release.
- Institutional Trimming and Insider Net Selling: Recent SEC 13F filings reveal notable institutional position reductions, including Range Financial Group cutting its stake by 63.8%, alongside $2.66 billion in net insider selling over the past year, reflecting growing institutional risk-off sentiment at current valuation multiples.
- Accumulated Balance Sheet Leverage from Strategic Acquisitions: Recent financial disclosures highlight $35.7 billion in debt issued over three years to fund acquired IPR&D and pipeline acquisitions, elevating financial risk and capital structure sensitivity if upcoming late-stage pipeline readouts face regulatory setbacks.
Recommended Articles


