


XRP (XRPUSD) Is up 3.41% on Oct 19: Here Is Why
XRP (XRPUSD) is up 3.41% at Oct 19 20:00(ET), now at $1.307, with a 7-day down of 4.39%.
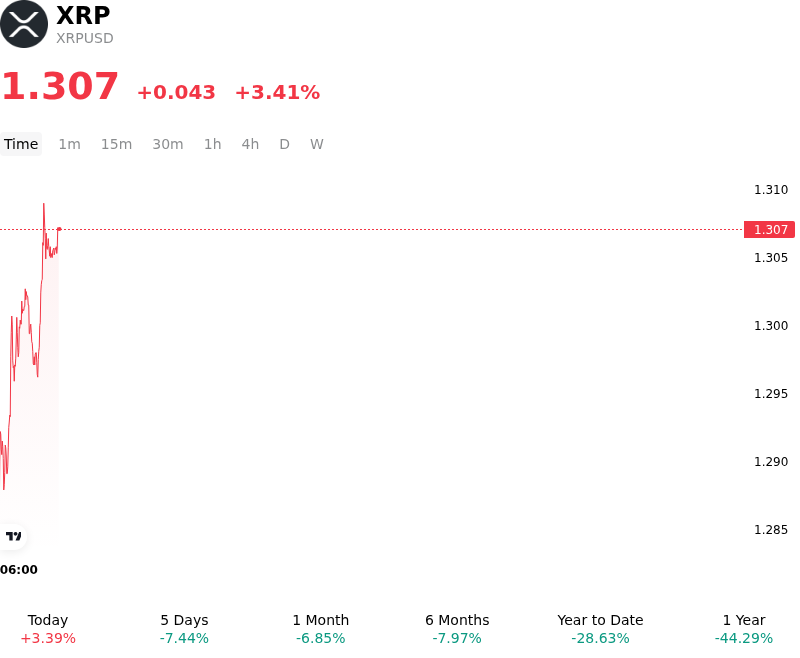
What is driving XRP (XRPUSD)’s stock price up today?
The upward movement in XRP reflects a combination of sustained spot ETF institutional demand, expanding enterprise utility on the XRP Ledger, and favorable liquidity dynamics following recent spot accumulation. Despite broader macroeconomic volatility and shifting sentiment across risk assets, institutional capital inflows into spot XRP exchange-traded products have demonstrated notable resilience, absorbing market liquidity and tightening exchange-side circulating supply.
A key structural driver behind the improved investor sentiment is the continued momentum surrounding enterprise adoption and infrastructure deployment. Recent integrations of institutional stablecoin settlement rails on the XRP Ledger—alongside expanding banking partnerships across key international capital markets—have bolstered long-term adoption expectations. Furthermore, the introduction of equity-market vehicles offering structured XRP treasury exposure has broadened the spectrum of institutional participation, reinforcing the token's core narrative as a primary settlement and liquidity layer for cross-border financial architecture.
From a market microstructure and liquidity perspective, the price advance was accelerated by derivatives positioning. Short positions built up during prior market consolidations were forced to cover as spot buying cleared key localized resistance levels. This short squeeze was further amplified by reduced token availability on centralized exchanges, where multi-month net outflows have constrained immediate sell-side liquidity.
While macro liquidity conditions and broader monetary policy expectations continue to induce periodic volatility across digital asset markets, XRP's outperformance highlights a divergence driven by asset-specific institutional flows and fundamental ecosystem developments. However, market participants continue to monitor potential headwinds, including shifts in global interest rate expectations, broad-based altcoin liquidity conditions, and regulatory clarity regarding tokenized asset frameworks. In the near term, persistent institutional ETF allocations and network transaction volume remain the primary catalysts sustaining the asset's structural strength.
Technical Analysis of XRP (XRPUSD)
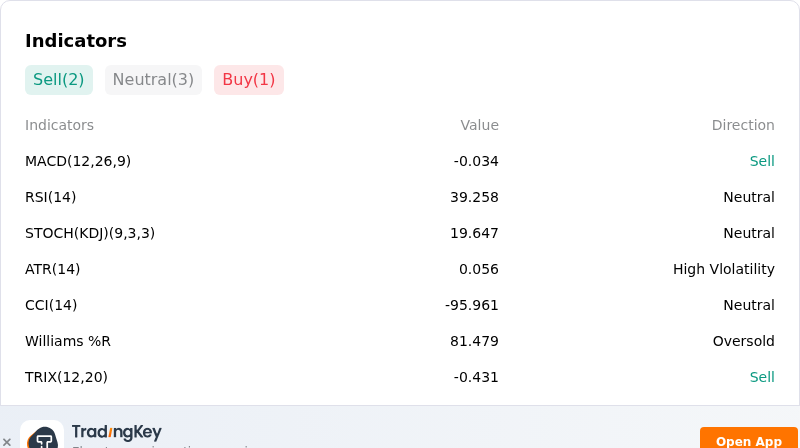
Technically, XRP (XRPUSD) shows a MACD (12,26,9) value of -0.034, indicating a sell signal. The RSI at 39.258 suggests neutral condition and the Williams %R at 81.479 suggests oversold condition. Please monitor closely.
More details about XRP (XRPUSD)
Recent Events and Risks:
- Whale Exchange Inflows and Distribution Risk: On-chain tracking from CryptoQuant revealed a seven-month high in large-holder exchange deposits, with whales transferring over 1.66 billion XRP to Binance and driving cumulative centralized exchange balances to 22.06 billion XRP, raising market concerns over potential spot liquidity unwinds and selling pressure.
- Over-Leveraged Underwater Long Positions: Derivatives market analysis flagged that roughly 97% of net-long futures positions were entered at prices above $1.31, leaving leveraged bullish accounts severely exposed to margin calls and potential liquidation cascades if spot prices break below immediate support levels.
- Institutional ETF Outflows and Falling Futures Interest: XRP-focused spot exchange-traded funds recorded over $1.8 million in net weekly redemptions, ending a 13-week consecutive inflow streak, while XRP futures open interest dropped roughly 26% to $2.8 billion, signaling a sharp decline in institutional demand and speculative leverage.
- Macro Risk-Off Sentiment and Technical Breakdown: Accelerated U.S. CPI inflation figures and high Treasury yields sparked broader crypto sell-offs, pushing XRP down to retest critical SuperTrend support near $1.30 with technical indicators warning of a potential deeper drop toward $1.25 if short-term moving average resistance holds.
Recommended Articles


