


Ethereum (ETHUSD) Is down 1.00% on Oct 16: What Are the Risk Factors?
Ethereum (ETHUSD) is down 1.00% at Oct 16 23:40(ET), now at $2427.41, with a 7-day down of 2.15%.
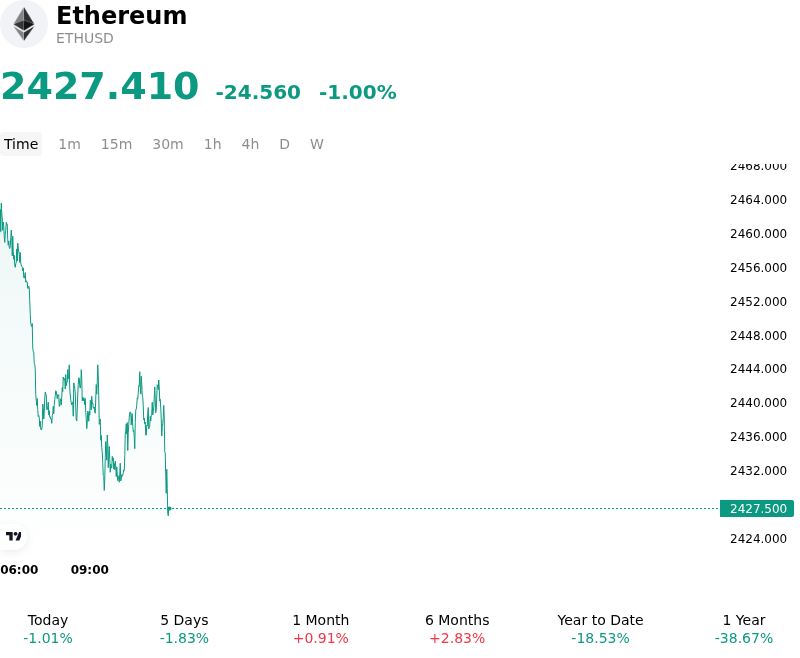
What is driving Ethereum (ETHUSD)’s stock price down today?
Recent macroeconomic headwinds, driven by persistent inflation metrics and elevated U.S. Treasury yields, pushed digital assets into a defensive posture as investors recalibrated expectations around Federal Reserve monetary policy. The prospect of sustained interest rate pressures strengthened the U.S. dollar, weighing on broader risk appetite and prompting market participants to reduce exposure to higher-beta digital assets like Ethereum.
Institutional liquidity conditions worsened as spot Ethereum ETFs experienced renewed net outflows, led by major funds such as BlackRock's ETHA. The persistent net redemptions from institutional spot vehicles eroded key spot liquidity buffers, weakening the structural buying support that had previously anchored price action near critical technical moving averages.
Derivatives positioning exacerbated the downward bias, triggering localized long liquidations across major derivatives venues. As leveraged longs were systematically closed out, total open interest contracted, reflecting a cautious shift in market sentiment. Concurrently, capital rotated toward stablecoins and Bitcoin, driving up Bitcoin market dominance and leaving Ethereum vulnerable to sell-side imbalance.
While short-term price dynamics reflect broader macroeconomic repricing and institutional de-risking, Ethereum's core ecosystem metrics—such as Layer-2 adoption, decentralized finance activity, and network staking engagement—continue to exhibit long-term structural resilience. Investors remain focused on upcoming macroeconomic data releases, Federal Reserve rate guidance, and the stabilization of spot ETF flows as primary catalysts for near-term trend directional clarity.
Technical Analysis of Ethereum (ETHUSD)
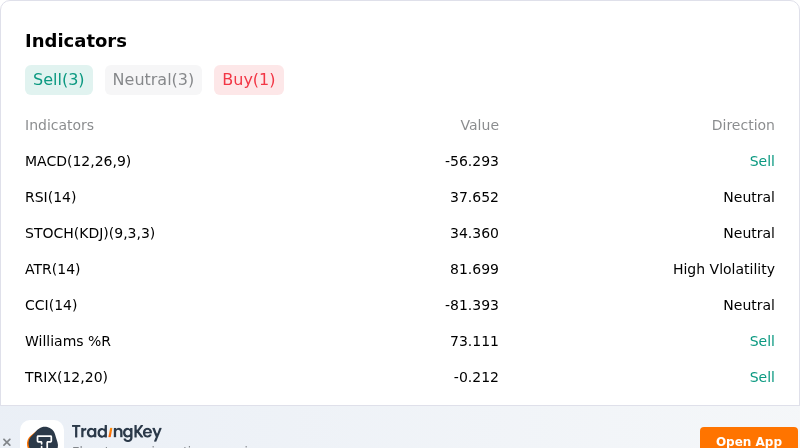
Technically, Ethereum (ETHUSD) shows a MACD (12,26,9) value of -56.293, indicating a sell signal. The RSI at 37.652 suggests neutral condition and the Williams %R at 73.111 suggests sell condition. Please monitor closely.
More details about Ethereum (ETHUSD)
Recent Events and Risks:
- Institutional Spot ETF Capital Outflows: Following a brief single-day inflow, U.S. spot Ethereum ETFs experienced a sharp reversal into negative flows, shedding $129.51 million in net daily redemptions led by $109.83 million in withdrawals from BlackRock's ETHA. This sudden resumption of institutional capital exits erases buying liquidity and heightens supply-side pressure on spot exchanges.
- Long Position Liquidations and Derivatives Pressure: Derivatives markets suffered a sharp leverage unwind as over $157 million in ETH positions were liquidated on Binance alone, with total crypto long liquidations topping $891 million in 24 hours. With ETH testing key technical support around $2,350 and net taker volume leaning heavily sell-side, failure to defend current levels risks triggering secondary liquidation cascades toward $2,200.
- Macroeconomic Tightening and Risk-Off Repricing: Hotter-than-expected U.S. Consumer Price Index inflation data—rising to 3.7% year-over-year—spurred market expectations of further Federal Reserve rate hikes and elevated bond yields. The resulting cross-asset selloff in tech equities spilled directly into digital assets, triggering high-beta risk-off liquidations across Ethereum pairs.
- Weakening Spot Demand and Exchange Transfers: On-chain sentiment has cooled as the Coinbase Premium Index turned negative to -0.117, signaling depressed U.S. retail and institutional buying relative to offshore platforms. Meanwhile, market concern has been exacerbated by legacy Ethereum wallet transfers moving over 4,300 ETH to exchange deposit addresses and major corporate buyers approaching accumulation limits.
Recommended Articles


