


Verizon Communications Inc Stock (VZ) Closed Down by 3.28% on Sep 16: Key Drivers Unveiled
Verizon Communications Inc (VZ) closed down by 3.28%. The Telecommunications Services sector is up by 2.46%. The company underperformed the industry. Top 3 stocks by turnover in the sector: SpaceX (SPCX) up 5.15%; Verizon Communications Inc (VZ) down 3.28%; AT&T Inc (T) down 3.22%.
What is driving Verizon Communications Inc (VZ)’s stock price down today?
Verizon Communications experienced downward trading pressure during the session, influenced by a combination of sector-level capital reallocation, operational transitions in legacy infrastructure, and market digestion of recent capital spending commitments. A primary factor weighing on sentiment is the company's ongoing phase-out of legacy copper-based telecommunications networks in favor of fiber-optic and wireless solutions. While this transition enhances operational efficiency over the long term, near-term execution risks, regulatory compliance steps, and potential subscriber churn during legacy service disconnections have prompted short-term institutional caution. Furthermore, after a period of sustained outperformance relative to broader equity indices, profit-taking contributed to the intraday pullback.
From an industry and operational perspective, investor attention remains fixed on the substantial capital intensity required for next-generation telecom infrastructure. Recent multi-year, multi-billion dollar supply commitments to secure extensive optical fiber capacity for broadband expansion and artificial intelligence infrastructure underscore management's aggressive network modernization agenda. Although these investments reinforce long-term competitive positioning and business segment strength, they also limit immediate balance sheet flexibility. Simultaneously, public disclosures regarding routine insider equity sales under structured rule plans have added marginal pressure to sentiment in the short term.
On the macroeconomic front, high-dividend telecom equities remain sensitive to shifting yield environments and Federal Reserve policy expectations. As institutional portfolios rebalance across fixed-income assets and equity sectors, defensives face ongoing yield competition. Despite current intraday volatility driven by transition friction and sector rotation, Verizon's disciplined capital allocation strategy—evidenced by ongoing debt redemptions, consistent dividend distributions, and cash flow resilience—continues to support its core fundamental thesis for long-term income investors.
Technical Analysis of Verizon Communications Inc (VZ)
Technically, Verizon Communications Inc (VZ) shows a MACD (12,26,9) value of -0.244, indicating a neutral signal. The RSI at 52.570 suggests neutral condition and the Williams %R at 66.960 suggests sell condition. Please monitor closely.
Media Coverage of Verizon Communications Inc (VZ)
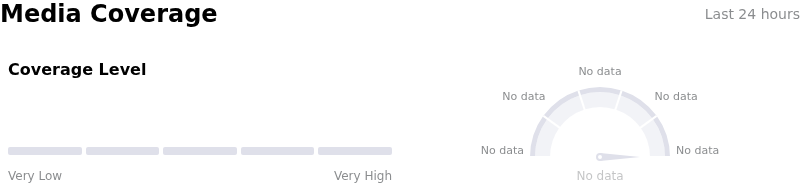
In terms of media coverage, Verizon Communications Inc (VZ) shows a coverage score of 48, indicating a moderate level of media attention. The overall market sentiment index is currently in extremely bullish zone.
Fundamental Analysis of Verizon Communications Inc (VZ)
Verizon Communications Inc (VZ) is in the Telecommunications Services industry. Its latest annual revenue is $138.19B, ranking 1 in the industry. The net profit is $17.17B, ranking 3 in the industry. Company Profile
Over the past month, multiple analysts have rated the company as Buy, with an average price target of $51.37, a high of $71.00, and a low of $44.00.
More details about Verizon Communications Inc (VZ)
Company Specific Risks:
- Heavy Capital Expenditure and Fiber Expansion Costs: Multi-billion dollar capital commitments for next-generation network upgrades and ongoing integration expenses for expanded fiber passings risk weighing on free cash flow margins if broadband subscriber adoption or pricing power weakens.
- Executive Share Sale Filings: Form 144 regulatory filings submitted on September 15, 2026, disclosed planned stock sales by executive officer Kyle Malady, representing a recurring pattern of insider liquidations that fuels market concern over internal valuation expectations.
- High Dividend Payout Ratio and Financial Leverage: A elevated dividend payout ratio exceeding 77% alongside substantial long-term debt servicing burdens constrains balance sheet flexibility and restricts free cash flow allocation for unexpected operational shocks.
- Regulatory Penalties and Ongoing Compliance Overhead: Regulatory enforcement actions, including disclosures around FCC fines and related legal obligations, continue to introduce cost pressures and create non-operating expense headwinds.
Recommended Articles


