


Ethereum (ETHUSD) Fluctuated Significantly on Sep 16: Key Variables Behind the Move
Ethereum (ETHUSD) is down 1.01% at Sep 16 13:35(ET), now at $2381.23, with a 7-day down of 3.57%.
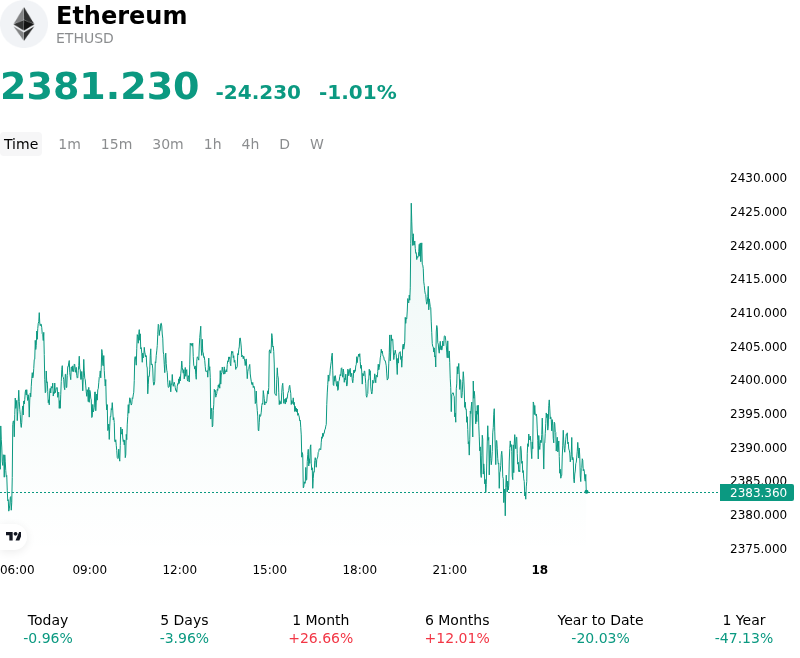
What is driving Ethereum (ETHUSD)’s stock price down today?
The recent downside movement in Ether was primarily driven by a macroeconomic liquidity tightening environment alongside adverse regulatory developments in the United States. Ahead of the Federal Reserve policy decision, market participants priced in heightened expectations of restrictive monetary policy, pushing Treasury yields upward and suppressing demand for high-beta risk assets. Concurrently, investor sentiment deteriorated following procedural hurdles for digital asset legislation in the U.S. Senate. The inability to advance clear statutory framework guidelines for smart-contract platforms injected regulatory uncertainty, undermining medium-term institutional adoption narratives and triggering a broad risk-off repricing across the altcoin ecosystem.
Capital flows in spot Ethereum exchange-traded funds shifted as institutional investors trimmed exposure following a prolonged period of strong accumulation. Single-day net redemptions across spot ETH products highlighted a tactical rotation into defensive positioning, as institutional desks de-risked ahead of central bank communication. While structural on-chain supply dynamics, such as constrained exchange reserves and elevated staking participation, continue to provide long-term supply friction, short-term spot market liquidity was overwhelmed by institutional profit-taking and reduced primary market creation activity.
In the derivatives market, the price pullback below key dynamic support levels catalyzed a cascade of long liquidations. As leverage unwound rapidly across major trading venues, forced selling exacerbated downward price momentum and temporarily thinned order-book liquidity. Open interest contracted as leveraged traders reduced directional exposure, shifting options skew toward downside protection. Although oversold momentum indicators suggest the immediate sell-off may be reaching temporary equilibrium, overall market structure remains constrained by cautious macro risk appetite and a temporary vacuum of near-term bullish catalysts.
Technical Analysis of Ethereum (ETHUSD)
Technically, Ethereum (ETHUSD) shows a MACD (12,26,9) value of -53.067, indicating a neutral signal. The RSI at 48.776 suggests neutral condition and the Williams %R at 90.791 suggests oversold condition. Please monitor closely.
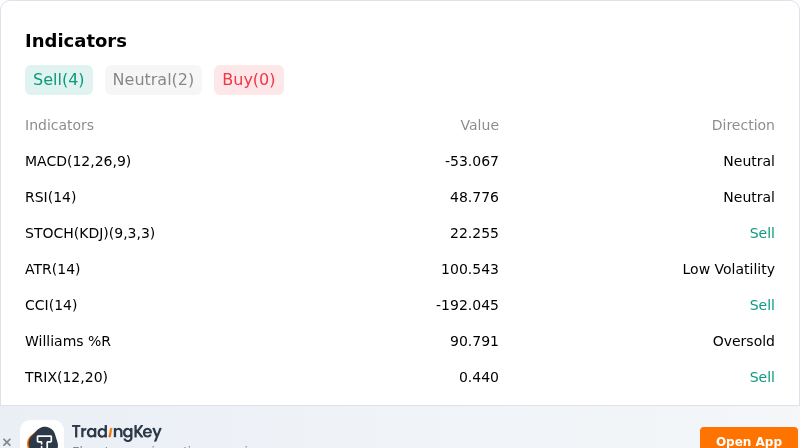
More details about Ethereum (ETHUSD)
Recent Events and Risks:
- Legislative and Regulatory Uncertainty: The procedural failure of the U.S. Senate to advance the Digital Asset Market Clarity Act has reignited regulatory ambiguity regarding smart contract platforms and token classification, prompting market participants to rapidly reduce risk exposure across major cryptocurrencies.
- Institutional ETF Capital Outflows: Spot Ethereum ETFs recorded severe net daily outflows of $141.5 million, marking a dramatic single-session reversal in institutional demand that is exerting sustained spot selling pressure.
- Macro Risk-Off Sentiment Ahead of Fed Decision: Heightened market expectations surrounding tighter Federal Reserve monetary policy and elevated U.S. Treasury yields have sparked broad-based risk-off sentiment, dampening speculative capital inflows and pressuring digital assets.
- Leveraged Liquidation Cascades and Technical Breakdown: Ethereum's breakdown below key support levels near $2,400 triggered tens of millions of dollars in forced long liquidations, accelerating downside momentum and opening technical risk toward the $2,270 to $2,222 support band.
Recommended Articles


