


J B Hunt Transport Services Inc Stock (JBHT) Moved Down by 13.71% on Sep 16: A Full Analysis
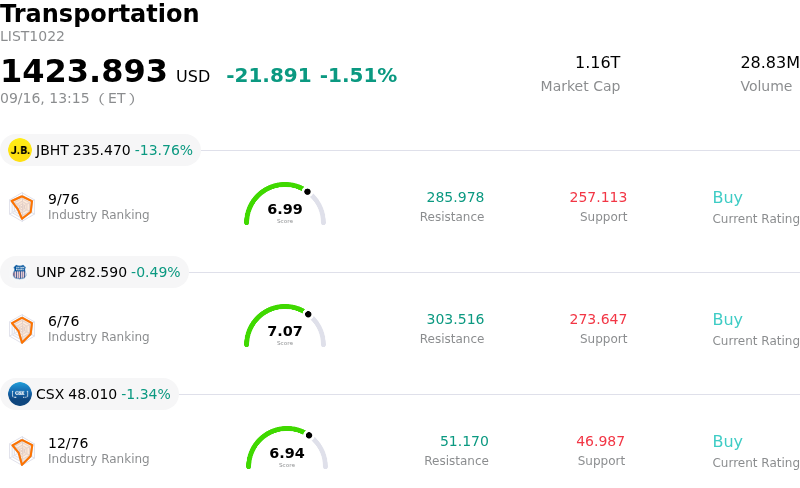
J B Hunt Transport Services Inc (JBHT) moved down by 13.71%. The Transportation sector is down by 1.51%. The company underperformed the industry. Top 3 stocks by turnover in the sector: J B Hunt Transport Services Inc (JBHT) down 13.76%; Union Pacific Corp (UNP) down 0.49%; CSX Corp (CSX) down 1.34%.
What is driving J B Hunt Transport Services Inc (JBHT)’s stock price down today?
J.B. Hunt Transport Services experienced severe downside pressure following an unexpected intra-quarter earnings warning issued by company executives at an industry investor conference. Management signaled that third-quarter earnings per share are projected to decline sequentially compared to the second quarter, catching Wall Street off guard given that market consensus had anticipated quarter-over-quarter growth. The rare mid-quarter guidance revision sparked immediate repricing across the stock as investors recalibrated near-term profitability expectations for the freight giant.
The primary catalyst behind the anticipated margin contraction is a sharp acceleration in operating expenses that has outpaced near-term pricing adjustments. Management highlighted a rapid increase in diesel fuel prices, where fuel surcharge cost recoveries operate on a operational lag, leaving the firm temporarily exposed to rising energy expenses. In addition, elevated driver recruitment and retention expenses, alongside rising drayage and purchased transportation costs, have created substantial cost friction as the company prepares for the peak shipping season.
The guidance cut prompted a wave of immediate Wall Street analyst reactions. Major equity research firms swiftly reduced their price targets and lowered third-quarter and full-year earnings forecasts, citing compressed operating margins and delayed cost pass-through. The unexpected update triggered increased derivatives volatility and institutional portfolio adjustments, reflecting heightened caution around short-term margin pressures in the intermodal and trucking sectors.
Technical Analysis of J B Hunt Transport Services Inc (JBHT)
Technically, J B Hunt Transport Services Inc (JBHT) shows a MACD (12,26,9) value of -2.204, indicating a sell signal. The RSI at 30.638 suggests neutral condition and the Williams %R at 99.251 suggests oversold condition. Please monitor closely.
Fundamental Analysis of J B Hunt Transport Services Inc (JBHT)
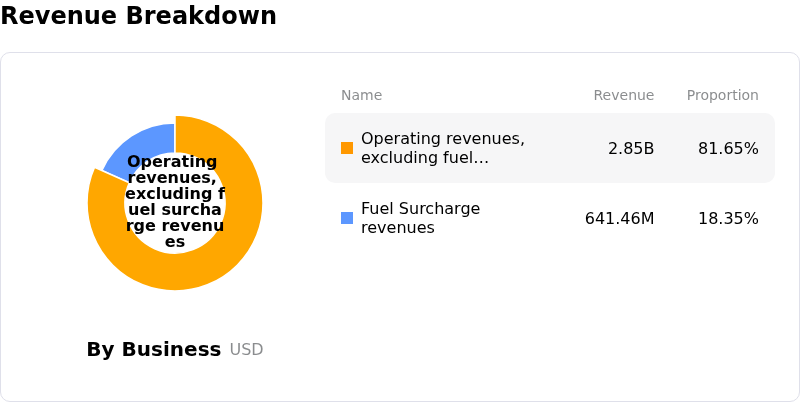
J B Hunt Transport Services Inc (JBHT) is in the Transportation industry. Its latest annual revenue is $12.00B, ranking 10 in the industry. The net profit is $598.28M, ranking 12 in the industry. Company Profile
Over the past month, multiple analysts have rated the company as Buy, with an average price target of $304.64, a high of $370.00, and a low of $172.39.
More details about J B Hunt Transport Services Inc (JBHT)
Company Specific Risks:
- Unexpected Intra-Quarter Earnings Downgrade: Management issued a rare mid-quarter profit warning, alerting investors to an expected 5% to 10% sequential decline in third-quarter earnings relative to Q2, driven by worsening operating expense headwinds.
- Surging Fuel and Driver Cost Pressures: Operating margins are under severe strain from an estimated $10 million sequential fuel cost headwind—exacerbated by delayed fuel-surcharge recovery—and an additional $25 million in elevated driver recruitment, onboarding, and training expenses.
- Institutional Analyst Target Price Cuts: Wall Street brokerages swiftly downgraded their short-term financial outlooks, with Bank of America lowering its Q3 EPS estimate by 18% while cutting its price target to $302, alongside target reductions from Barclays (to $285) and Wells Fargo (to $305).
- Valuation Vulnerability Amid Estimate Reductions: Trading at a trailing price-to-earnings multiple of nearly 39x—well above its 5-year median of 27x—the stock faces heightened multiple compression risk as consensus estimates across 2026 are adjusted downward.
Recommended Articles


