


ConocoPhillips Stock (COP) Moved Down by 3.80% on Sep 16: What Investors Need To Know
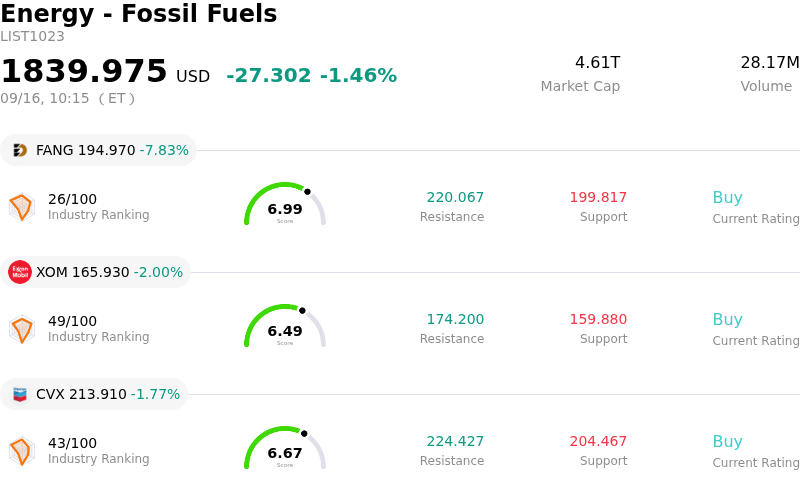
ConocoPhillips (COP) moved down by 3.80%. The Energy - Fossil Fuels sector is down by 1.46%. The company underperformed the industry. Top 3 stocks by turnover in the sector: Diamondback Energy Inc (FANG) down 7.83%; Exxon Mobil Corp (XOM) down 2.00%; Chevron Corp (CVX) down 1.77%.
What is driving ConocoPhillips (COP)’s stock price down today?
ConocoPhillips experienced notable downward pressure today, primarily driven by a sharp pull-back in global crude oil prices and sector-wide consolidation. Energy benchmark futures moved lower following industry data from the American Petroleum Institute that revealed a substantial and unexpected accumulation in U.S. crude oil, gasoline, and distillate inventories. This inventory build diverged significantly from consensus expectations of a drawdown, easing immediate supply tightness concerns and prompting traders to reduce risk exposure across energy equities.
The retrenchment was further amplified by technical profit-taking after the stock pushed into multi-month and 52-week high territory in preceding trading sessions. Following a sustained rally supported by geopolitical supply risk premiums and strong upstream operational execution, technical momentum indicators entered overbought territory. Valuation metrics sitting above intrinsic value estimates, alongside recent insider selling reports, created an environment ripe for profit realization once commodity tailwinds began to subside.
Macroeconomic headwinds also weighed on investor sentiment across the energy sector. Broad-market caution prevailed ahead of the upcoming Federal Reserve interest rate decision, as elevated Treasury yields and a strengthening U.S. dollar added pressure to commodity-linked assets. As a high-beta upstream exploration and production leader, ConocoPhillips proved particularly sensitive to the combination of falling underlying commodity prices and macro-level equity repositioning.
Despite the intraday decline, the fundamental narrative surrounding ConocoPhillips remains anchored by its low-cost asset portfolio, robust free cash flow generation, and commitment to disciplined capital returns. Institutional investors are expected to closely monitor official government inventory data and geopolitical developments in key maritime corridors to determine whether the current pullback marks a short-term consolidation or a broader shift in sector momentum.
Technical Analysis of ConocoPhillips (COP)
Technically, ConocoPhillips (COP) shows a MACD (12,26,9) value of -0.518, indicating a neutral signal. The RSI at 58.024 suggests neutral condition and the Williams %R at 42.327 suggests buy condition. Please monitor closely.
Media Coverage of ConocoPhillips (COP)
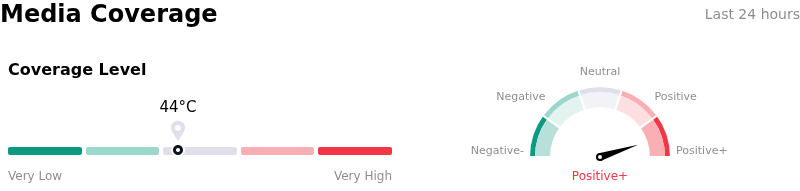
In terms of media coverage, ConocoPhillips (COP) shows a coverage score of 44, indicating a moderate level of media attention. The overall market sentiment index is currently in extremely bullish zone.
Fundamental Analysis of ConocoPhillips (COP)
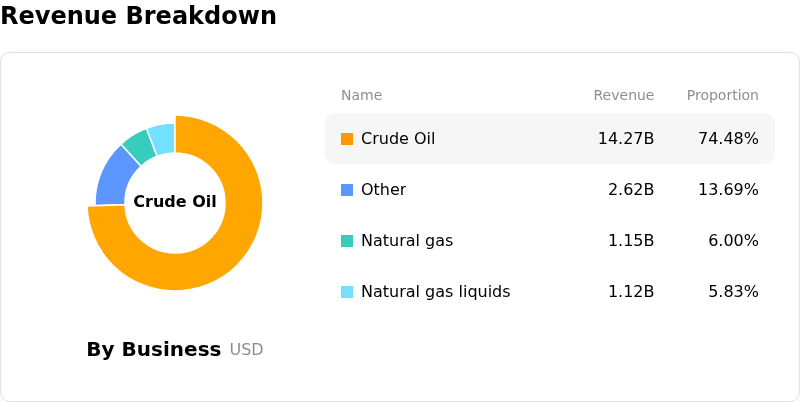
ConocoPhillips (COP) is in the Energy - Fossil Fuels industry. Its latest annual revenue is $58.94B, ranking 13 in the industry. The net profit is $7.96B, ranking 7 in the industry. Company Profile
Over the past month, multiple analysts have rated the company as Buy, with an average price target of $146.18, a high of $189.00, and a low of $119.34.
More details about ConocoPhillips (COP)
Company Specific Risks:
- Valuation Premium and Downside Correction Risk: Trading near 52-week highs around $141 per share, ConocoPhillips carries a trailing price-to-earnings ratio of 18.7x—well above its 5-year historical median of 12.5x—and sits roughly 15% above intrinsic value model estimates ($122.58), exposing the stock to sharp intraday pullbacks if earnings growth fails to sustain the premium multiple.
- Elevated Corporate Breakeven and Cash Flow Disadvantage: Institutional analysis highlights ConocoPhillips' relatively high corporate breakeven level of approximately $53/bbl WTI required to fully cover capital expenditures and dividend distributions, leaving its debt-adjusted free cash flow yield vulnerable during crude price volatility compared to lower-cost shale competitors.
- Capital Intensity and Execution Risks in Long-Cycle Megaprojects: Multi-year capital commitments focused on major long-cycle developments—notably the Willow project in Alaska and Port Arthur LNG—concentrate corporate cash flow expansion into a narrow project set, exposing near-term margins to legal hurdles, cost overruns, and delayed cash harvest timelines.
- Heightened SEC Insider Selling Activity: Recent SEC filings reveal substantial net insider selling totaling over $145 million, including divestments by executive officers and trust accounts, dampening institutional confidence in further short-term stock appreciation at current elevated levels.
Recommended Articles


