


Coinbase Global Inc Stock (COIN) Moved Down by 7.14% on Sep 15: Key Drivers Unveiled
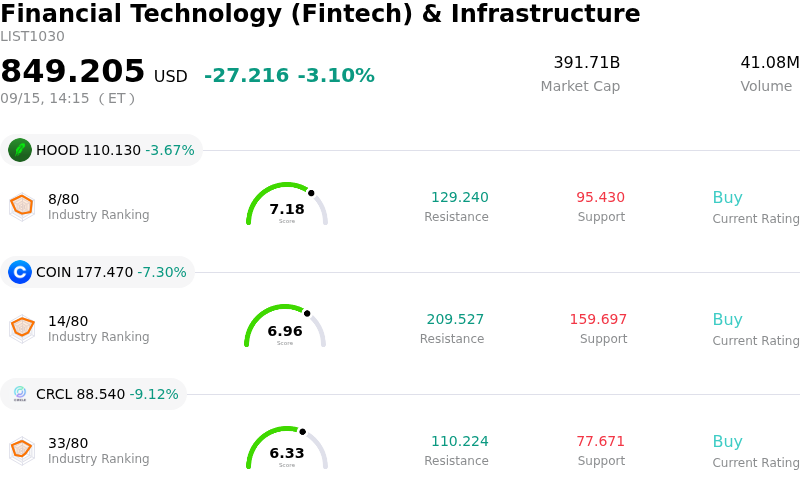
Coinbase Global Inc (COIN) moved down by 7.14%. The Financial Technology (Fintech) & Infrastructure sector is down by 3.10%. The company underperformed the industry. Top 3 stocks by turnover in the sector: Robinhood Markets Inc (HOOD) down 3.67%; Coinbase Global Inc (COIN) down 7.30%; Circle Internet Group Inc (CRCL) down 9.12%.
What is driving Coinbase Global Inc (COIN)’s stock price down today?
The pull-back in Coinbase shares reflects heightened intraday volatility as crypto-linked equities face simultaneous pressure from macroeconomic policy anxiety and legislative developments. With market participants closely monitoring central bank interest rate projections and pivotal Senate votes regarding digital asset market structure rules, risk premiums across digital asset equities have expanded. Broader softness in underlying spot cryptocurrency prices directly threatens short-term trading volumes and transaction fee generation, prompting institutional desks to trim high-beta exposure and lock in recent gains.
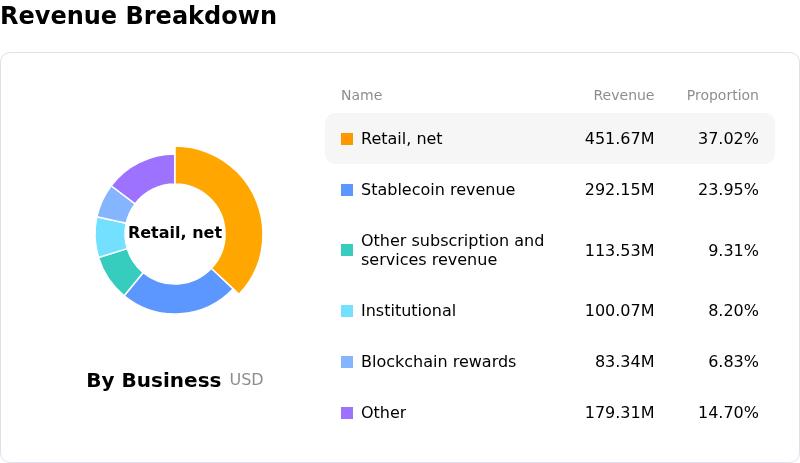
As a leveraged proxy for broader cryptocurrency market activity, Coinbase carries valuation multiples that demand sustained operational execution and robust trading volume. When spot market momentum falters, the stock is uniquely vulnerable to sharp sell-offs due to market sensitivity around transaction revenue reliance versus expanding operating expenses. Although non-transaction revenue sources such as subscription fees and stablecoin custody continue to diversify the top line over the long term, near-term quarterly expectations remain heavily exposed to cyclical swings in market liquidity and volatility.
Institutional positioning and market mechanics are also compounding today's price weakness. Recent regulatory disclosure of executive share sales executed under pre-scheduled trading plans, combined with elevated short interest across digital asset equities, has exacerbated downside price action during intraday liquidations. While expansion initiatives in protocol layer infrastructure and institutional custody partnerships provide structural growth catalysts, near-term stock performance will remain tightly linked to macro liquidity conditions, regulatory vote outcomes, and spot crypto market stabilization.
Technical Analysis of Coinbase Global Inc (COIN)
Technically, Coinbase Global Inc (COIN) shows a MACD (12,26,9) value of -1.240, indicating a neutral signal. The RSI at 51.889 suggests neutral condition and the Williams %R at 69.992 suggests sell condition. Please monitor closely.
Media Coverage of Coinbase Global Inc (COIN)
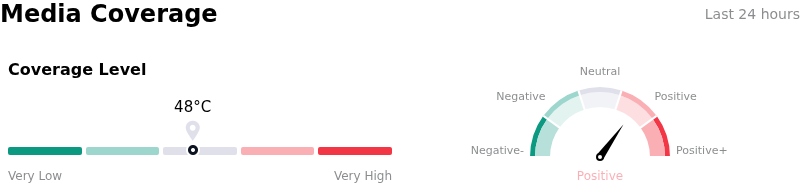
In terms of media coverage, Coinbase Global Inc (COIN) shows a coverage score of 48, indicating a moderate level of media attention. The overall market sentiment index is currently in bullish zone.
Fundamental Analysis of Coinbase Global Inc (COIN)
Coinbase Global Inc (COIN) is in the Financial Technology (Fintech) & Infrastructure industry. Its latest annual revenue is $7.18B, ranking 5 in the industry. The net profit is $1.26B, ranking 6 in the industry. Company Profile
Over the past month, multiple analysts have rated the company as Buy, with an average price target of $211.79, a high of $420.00, and a low of $85.00.
More details about Coinbase Global Inc (COIN)
Company Specific Risks:
- Legislative & Regulatory Impasse: Intraday stock volatility has spiked due to political pushback and uncertainty surrounding the Senate procedural vote on the Digital Asset Market Clarity Act (CLARITY Act), threatening to delay a clear federal regulatory framework for U.S. crypto exchanges.
- Crypto Spot Market Weakness: Coinbase shares face direct downward pressure from a sharp retreat in digital asset prices, with Bitcoin sliding into the $76,800 range and Ether experiencing steep declines, which directly compresses trading volume and core transaction revenue.
- Financial Underperformance & High Multiples: Wall Street analysts express continued concern over elevated valuation multiples following Q2 revenue misses ($1.22 billion versus $1.29 billion expected) and persistent net losses, making the stock highly sensitive to macro risk-off sentiment ahead of Federal Reserve interest rate decisions.
- Legal & Operational Expansion Friction: Recent SEC filings to introduce single-stock perpetual futures, combined with ongoing compliance and regulatory reporting costs stemming from customer data security incidents, keep legal, operational, and regulatory oversight risks high.
Recommended Articles


