


Thermo Fisher Scientific Inc Stock (TMO) Moved Up by 3.44% on Sep 15: Facts Behind the Movement
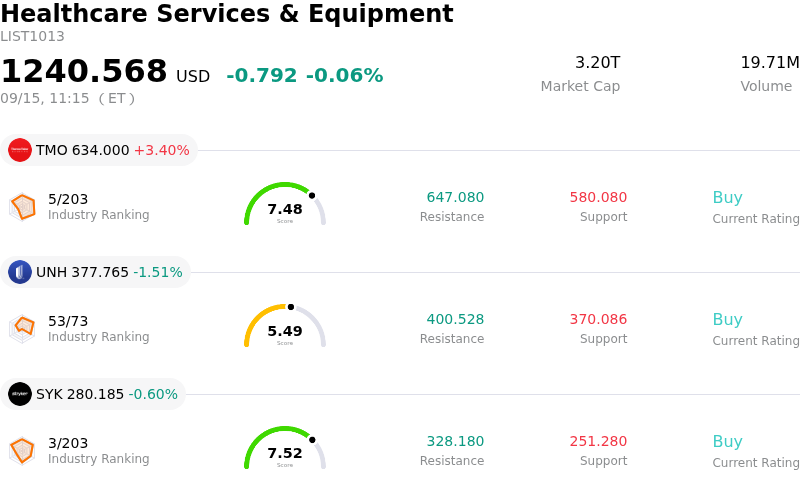
Thermo Fisher Scientific Inc (TMO) moved up by 3.44%. The Healthcare Services & Equipment sector is down by 0.06%. The company outperformed the industry. Top 3 stocks by turnover in the sector: Thermo Fisher Scientific Inc (TMO) up 3.40%; Unitedhealth Group Inc (UNH) down 1.51%; Stryker Corp (SYK) down 0.60%.
What is driving Thermo Fisher Scientific Inc (TMO)’s stock price up today?
Thermo Fisher Scientific experienced upward price momentum driven primarily by encouraging management commentary at the Morgan Stanley Global Healthcare Conference. Executive leadership highlighted accelerating operational momentum across core end-markets, emphasizing that the business is entering a stronger growth phase. Positive demand signals in biopharma research and clinical development, combined with solid execution in analytical instruments and laboratory services, reinforced investor confidence in the company's full-year outlook.
The constructive update builds upon recent quarterly financial strength and strategic portfolio enhancements, including key acquisitions in clinical research and targeted divestitures of non-core operations. Market participants responded positively to management's confirmation that client spending in life sciences and biotherapeutic development is steadily recovering. Furthermore, sustained demand for advanced mass spectrometry systems and automated laboratory solutions continues to support favorable margin expansion across its core divisions.
Underlying sentiment was also supported by institutional capital inflows and disciplined capital allocation. Recent regulatory disclosures showing increased holdings by major asset managers, alongside the stock reaching its quarterly ex-dividend date, provided strong baseline support. Combined with robust cash flow generation and solid long-term fundamentals, these drivers fueled significant buying interest throughout the trading session.
Technical Analysis of Thermo Fisher Scientific Inc (TMO)
Technically, Thermo Fisher Scientific Inc (TMO) shows a MACD (12,26,9) value of -3.933, indicating a neutral signal. The RSI at 65.067 suggests neutral condition and the Williams %R at 6.793 suggests overbought condition. Please monitor closely.
Fundamental Analysis of Thermo Fisher Scientific Inc (TMO)
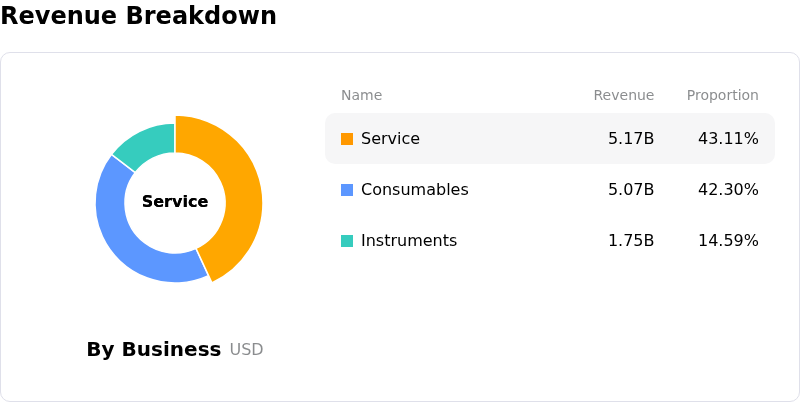
Thermo Fisher Scientific Inc (TMO) is in the Healthcare Services & Equipment industry. Its latest annual revenue is $44.56B, ranking 2 in the industry. The net profit is $6.70B, ranking 1 in the industry. Company Profile
Over the past month, multiple analysts have rated the company as Buy, with an average price target of $650.61, a high of $750.00, and a low of $553.65.
More details about Thermo Fisher Scientific Inc (TMO)
Company Specific Risks:
- Institutional Analyst Downgrades: Wells Fargo downgraded Thermo Fisher Scientific to "Underweight", while HSBC slashed its rating to "Hold", citing stagnant organic growth momentum and heightened risks of delayed medium-term financial targets.
- Bioprocessing and CDMO Demand Headwinds: Industry concerns regarding lower bioprocessing exposure relative to key peers and lingering uncertainty over contract development and manufacturing organization (CDMO) utilization levels pose risks to core segment revenue expansion.
- Biopharma Client Expenditure Drag: Ongoing inflationary pressures and elevated interest rates continue to restrict capital expenditure budgets across biopharmaceutical clients, weighing on orders for high-cost analytical instruments and laboratory equipment.
- Senior Executive Stock Dispositions: SEC Form 4 filings detailing recent insider equity sales by senior leadership—including transactions by the Chief Accounting Officer and Chief HR Officer—have added downward pressure on institutional sentiment during periods of intraday volatility.
Recommended Articles


