


USD/JPY (USDJPY) Moved Sharply on Sep 15: Are Central Bank Expectations Shifting?
USD/JPY (USDJPY) is up 0.54% at Sep 15 04:10(ET), now at $155.167, with a 7-day up of 0.79%.
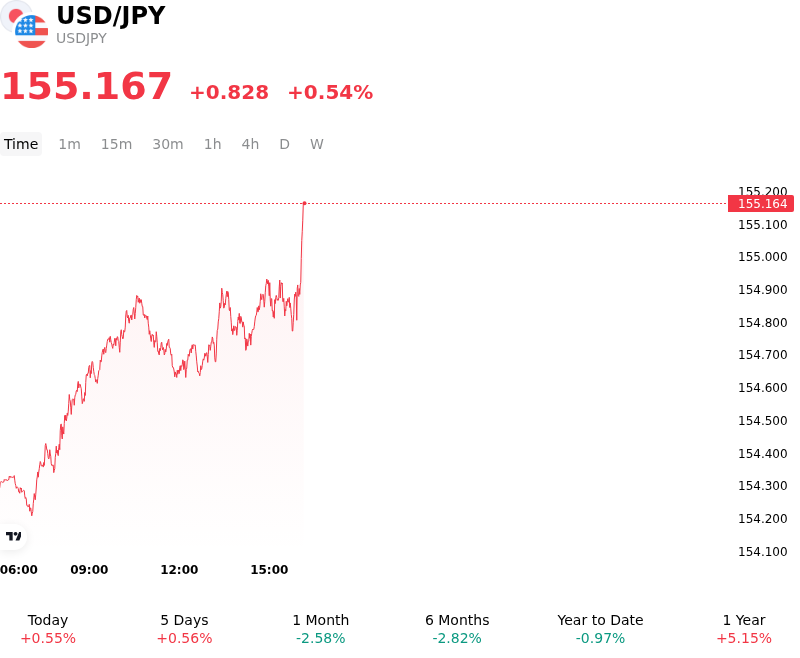
What is driving USD/JPY (USDJPY)’s stock price up today?
The upside momentum in USD/JPY was primarily driven by a rebound in the U.S. dollar and elevated U.S. Treasury yields ahead of monetary policy decisions from both the Federal Reserve and the Bank of Japan. Recent U.S. inflation figures highlighted sticky underlying price pressures, reinforcing expectations that the Federal Reserve will maintain a restrictive monetary stance. As U.S. Treasury yields remained firm across the curve, the substantial yield advantage enjoyed by the dollar continued to provide fundamental backing for the pair, encouraging greenback buying against the lower-yielding yen.
On the Japanese side, the yen faced headwinds as market participants reassessed aggressive pricing surrounding the Bank of Japan's rate-hiking trajectory. Following a strong rally in the yen driven by hawkish central bank rhetoric and a clearing out of speculative short positions, investors grew cautious that the BOJ's upcoming policy announcement might fall short of hawkish market expectations. With money markets having priced in a relatively steep path of Japanese rate increases, asymmetric disappointment risk prompted a tactical rebalancing out of recent yen longs, lifting USD/JPY higher.
Broad macro fundamentals continue to highlight a persistent interest-rate differential between U.S. and Japanese sovereign debt. Elevated U.S. yields, supported by firm economic activity and persistent fiscal borrowing needs, keep the carry-trade dynamic structurally supportive of the U.S. dollar. Although Japan is undergoing a gradual policy normalization cycle, the absolute rate spread remains wide, limiting structural capital repatriation into Japanese domestic assets without a more decisive hawkish catalyst from domestic policymakers.
Looking forward, the durability of this USD/JPY advance hinges on the forward guidance delivered at the upcoming FOMC and BOJ policy meetings. While firm U.S. yields provide a supportive floor for the dollar, any aggressive policy tightening or hawkish forward guidance from the Bank of Japan could quickly reactivate downside pressure on the pair. Additionally, market participants continue to monitor official Japanese verbal commentary, as potential intervention risks remain an important factor near key overhead technical resistance levels.
Technical Analysis of USD/JPY (USDJPY)
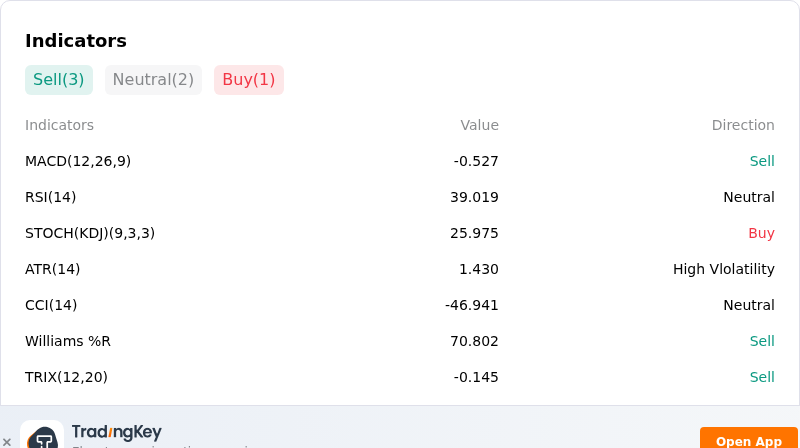
Technically, USD/JPY (USDJPY) shows a MACD (12,26,9) value of -0.527, indicating a sell signal. The RSI at 39.019 suggests neutral condition and the Williams %R at 70.802 suggests sell condition. Please monitor closely.
More details about USD/JPY (USDJPY)
Recent Events and Risks:
- Bank of Japan Hawkish Guidance Repricing: Aggressive market expectations for a Bank of Japan policy rate hike and hawkish forward guidance threaten to trigger significant short-Yen covering, placing strong downside pressure on USD/JPY.
- US-Japan Yield Spread Compression: Narrowing spreads between US Treasuries and Japanese Government Bonds reduce the yield advantage supporting the Greenback, creating immediate risks of intraday selling across the pair.
- Official FX Intervention and Policy Warnings: Lingering intervention risks from Japan's Ministry of Finance alongside foreign policy warnings discouraging bets against a stronger Yen keep long USD/JPY positioning vulnerable to sudden official liquidity shocks.
- Unwinding of Yen Carry Trade Positions: Rising domestic Japanese borrowing costs combined with episodes of broader market risk-off sentiment elevate the probability of rapid carry-trade unwinds, driving volatile intraday downside spikes for USD/JPY.
Recommended Articles


